Reanalysis Measurements
Marine heatwaves with respect to reanalysis
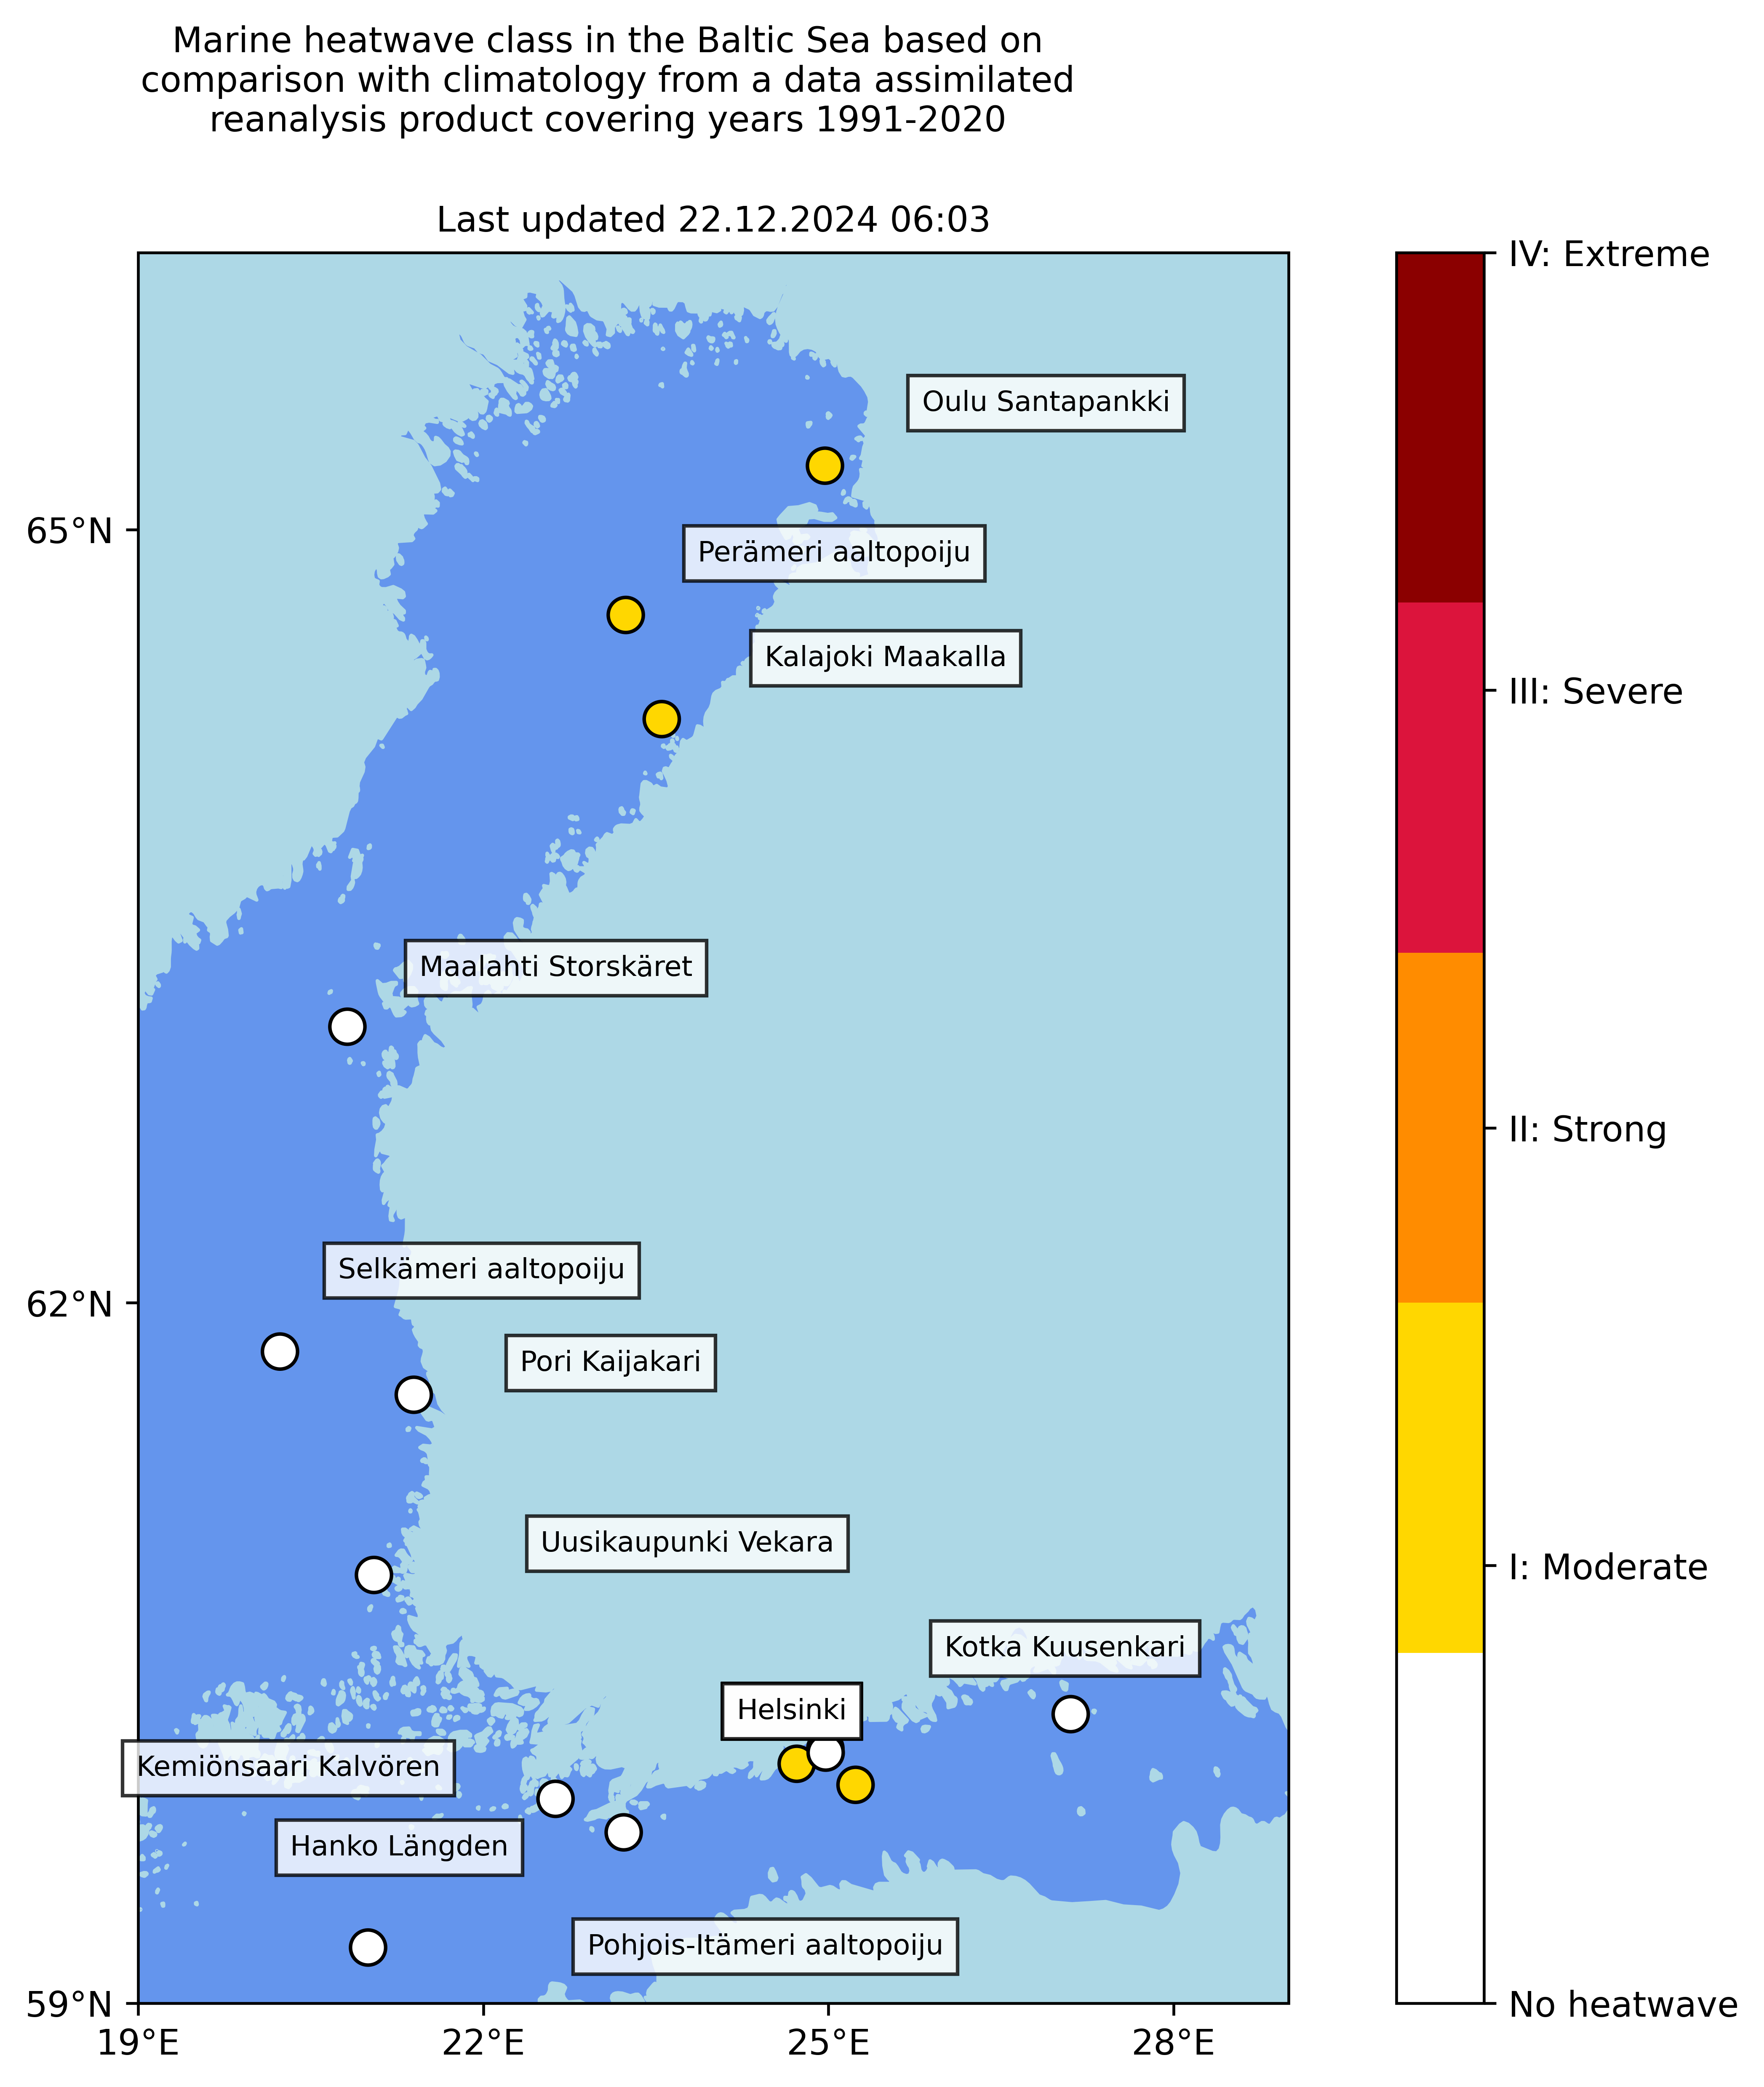
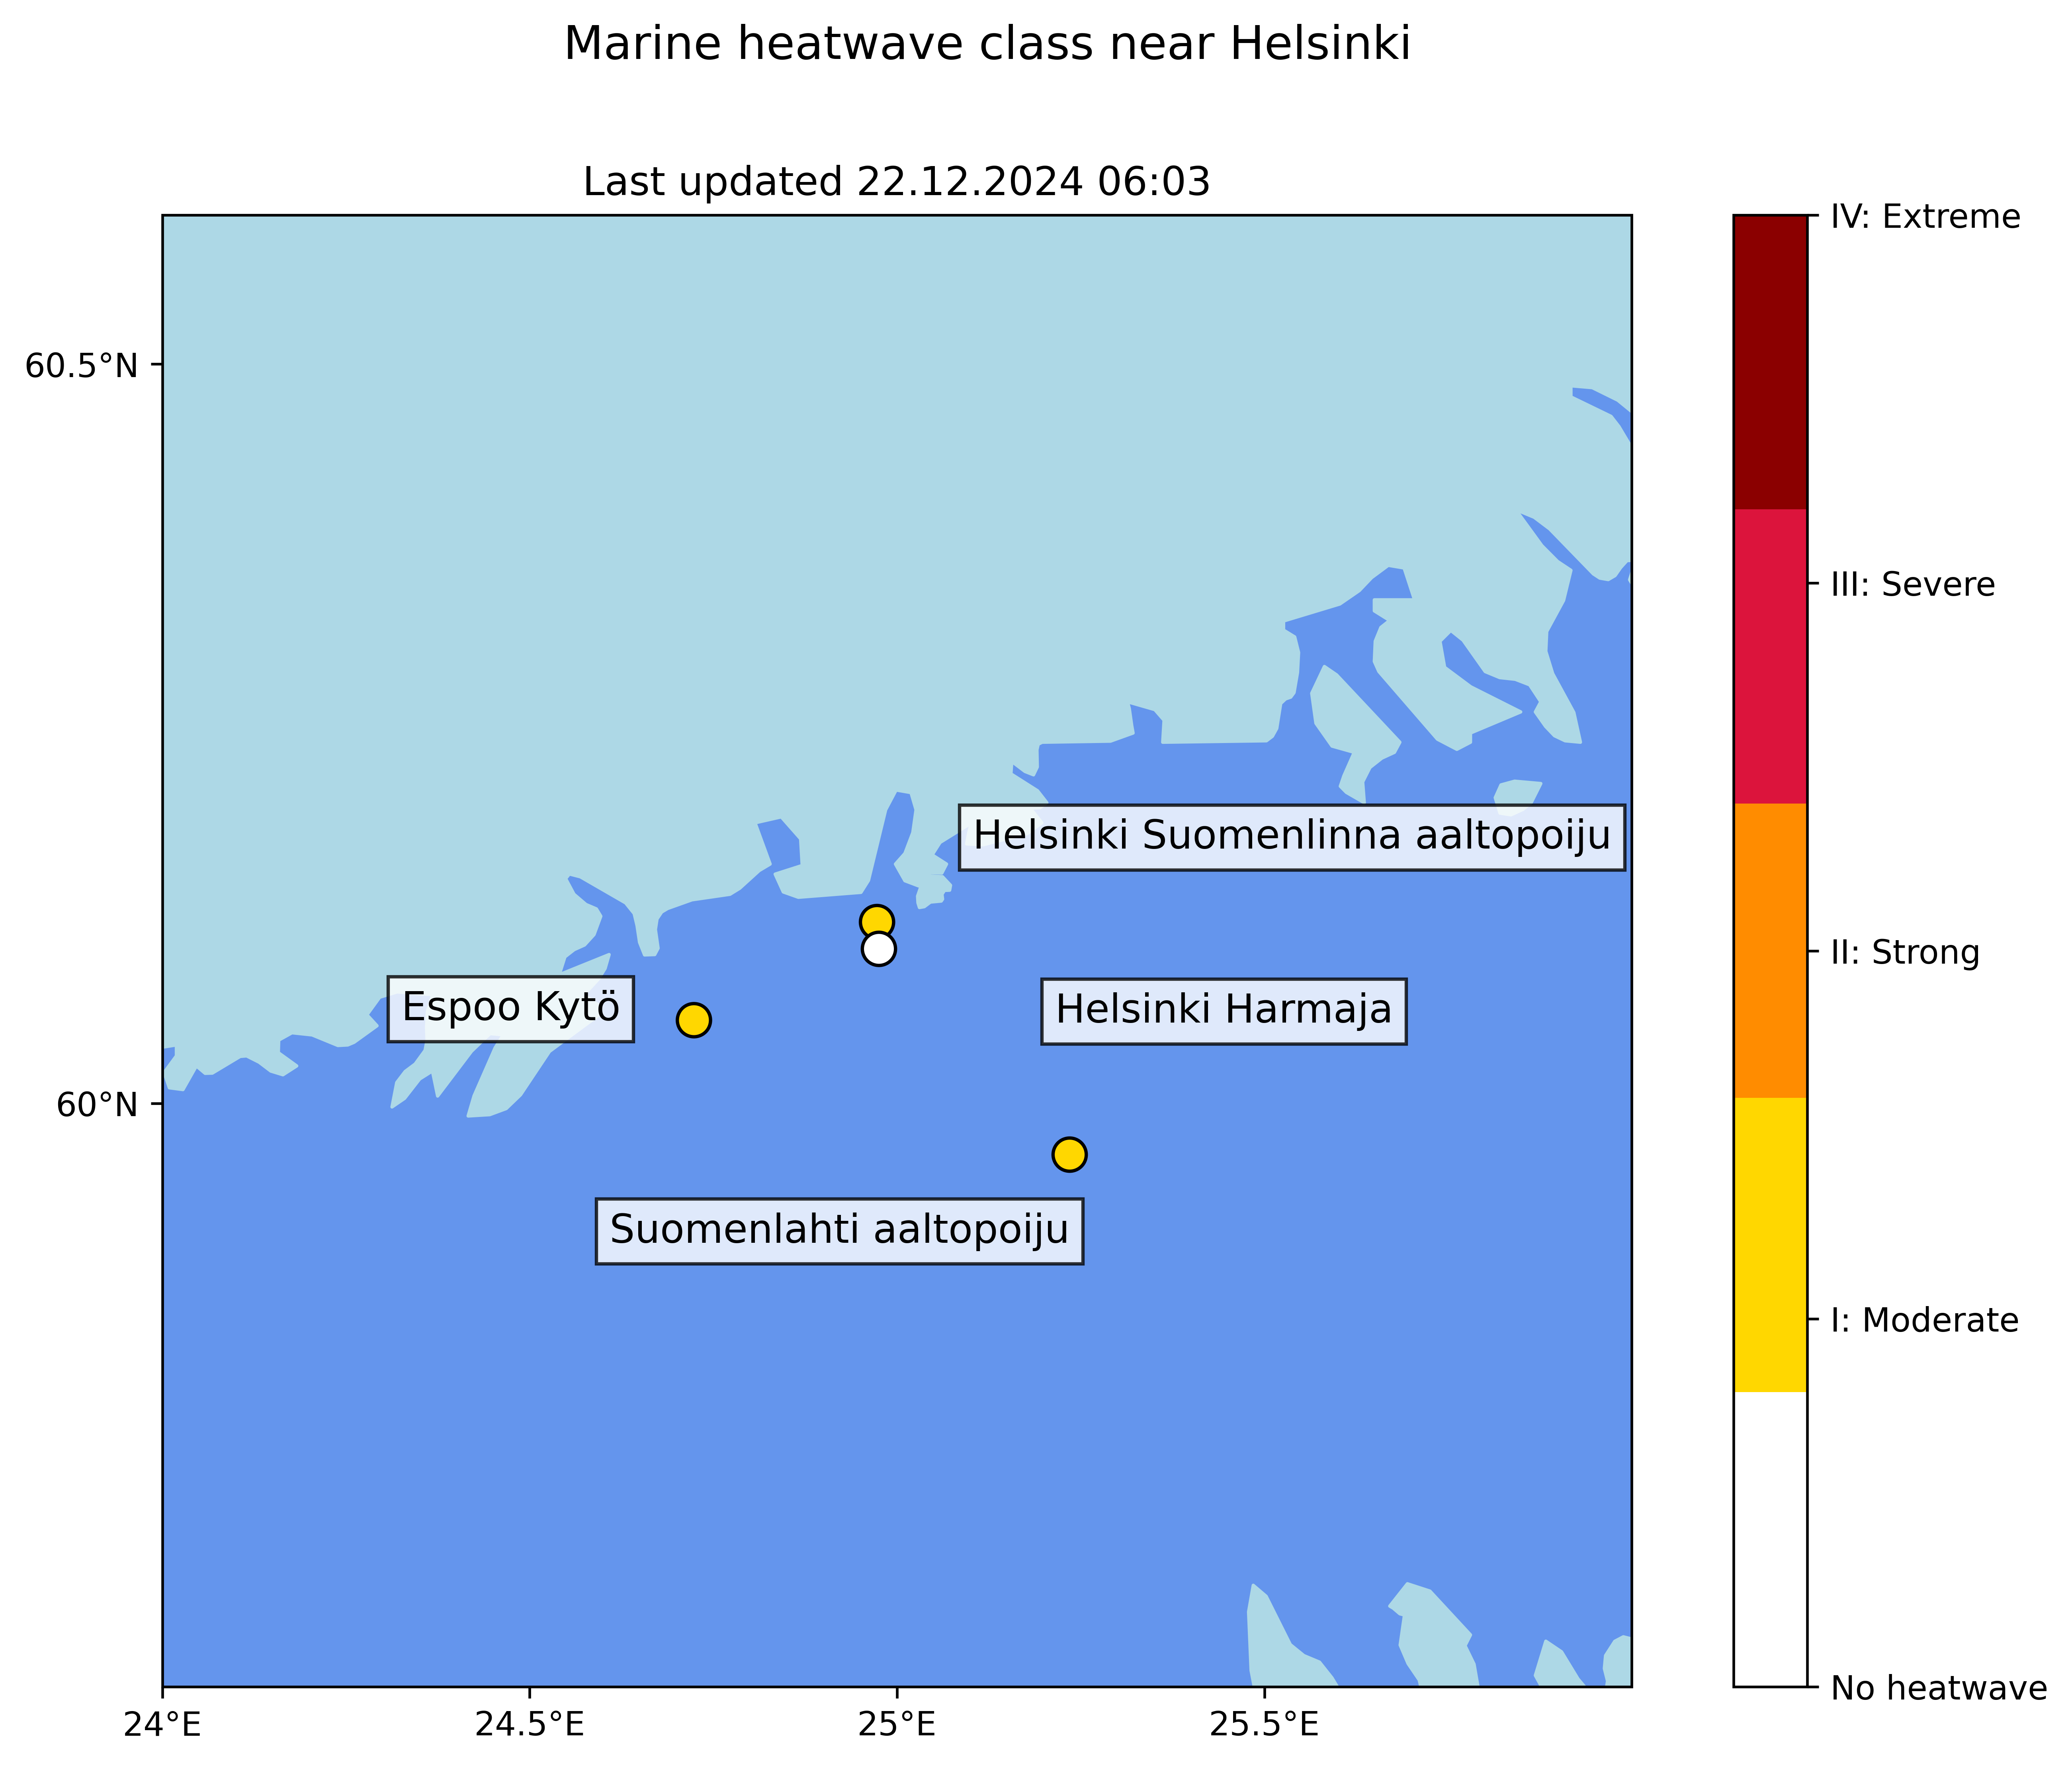
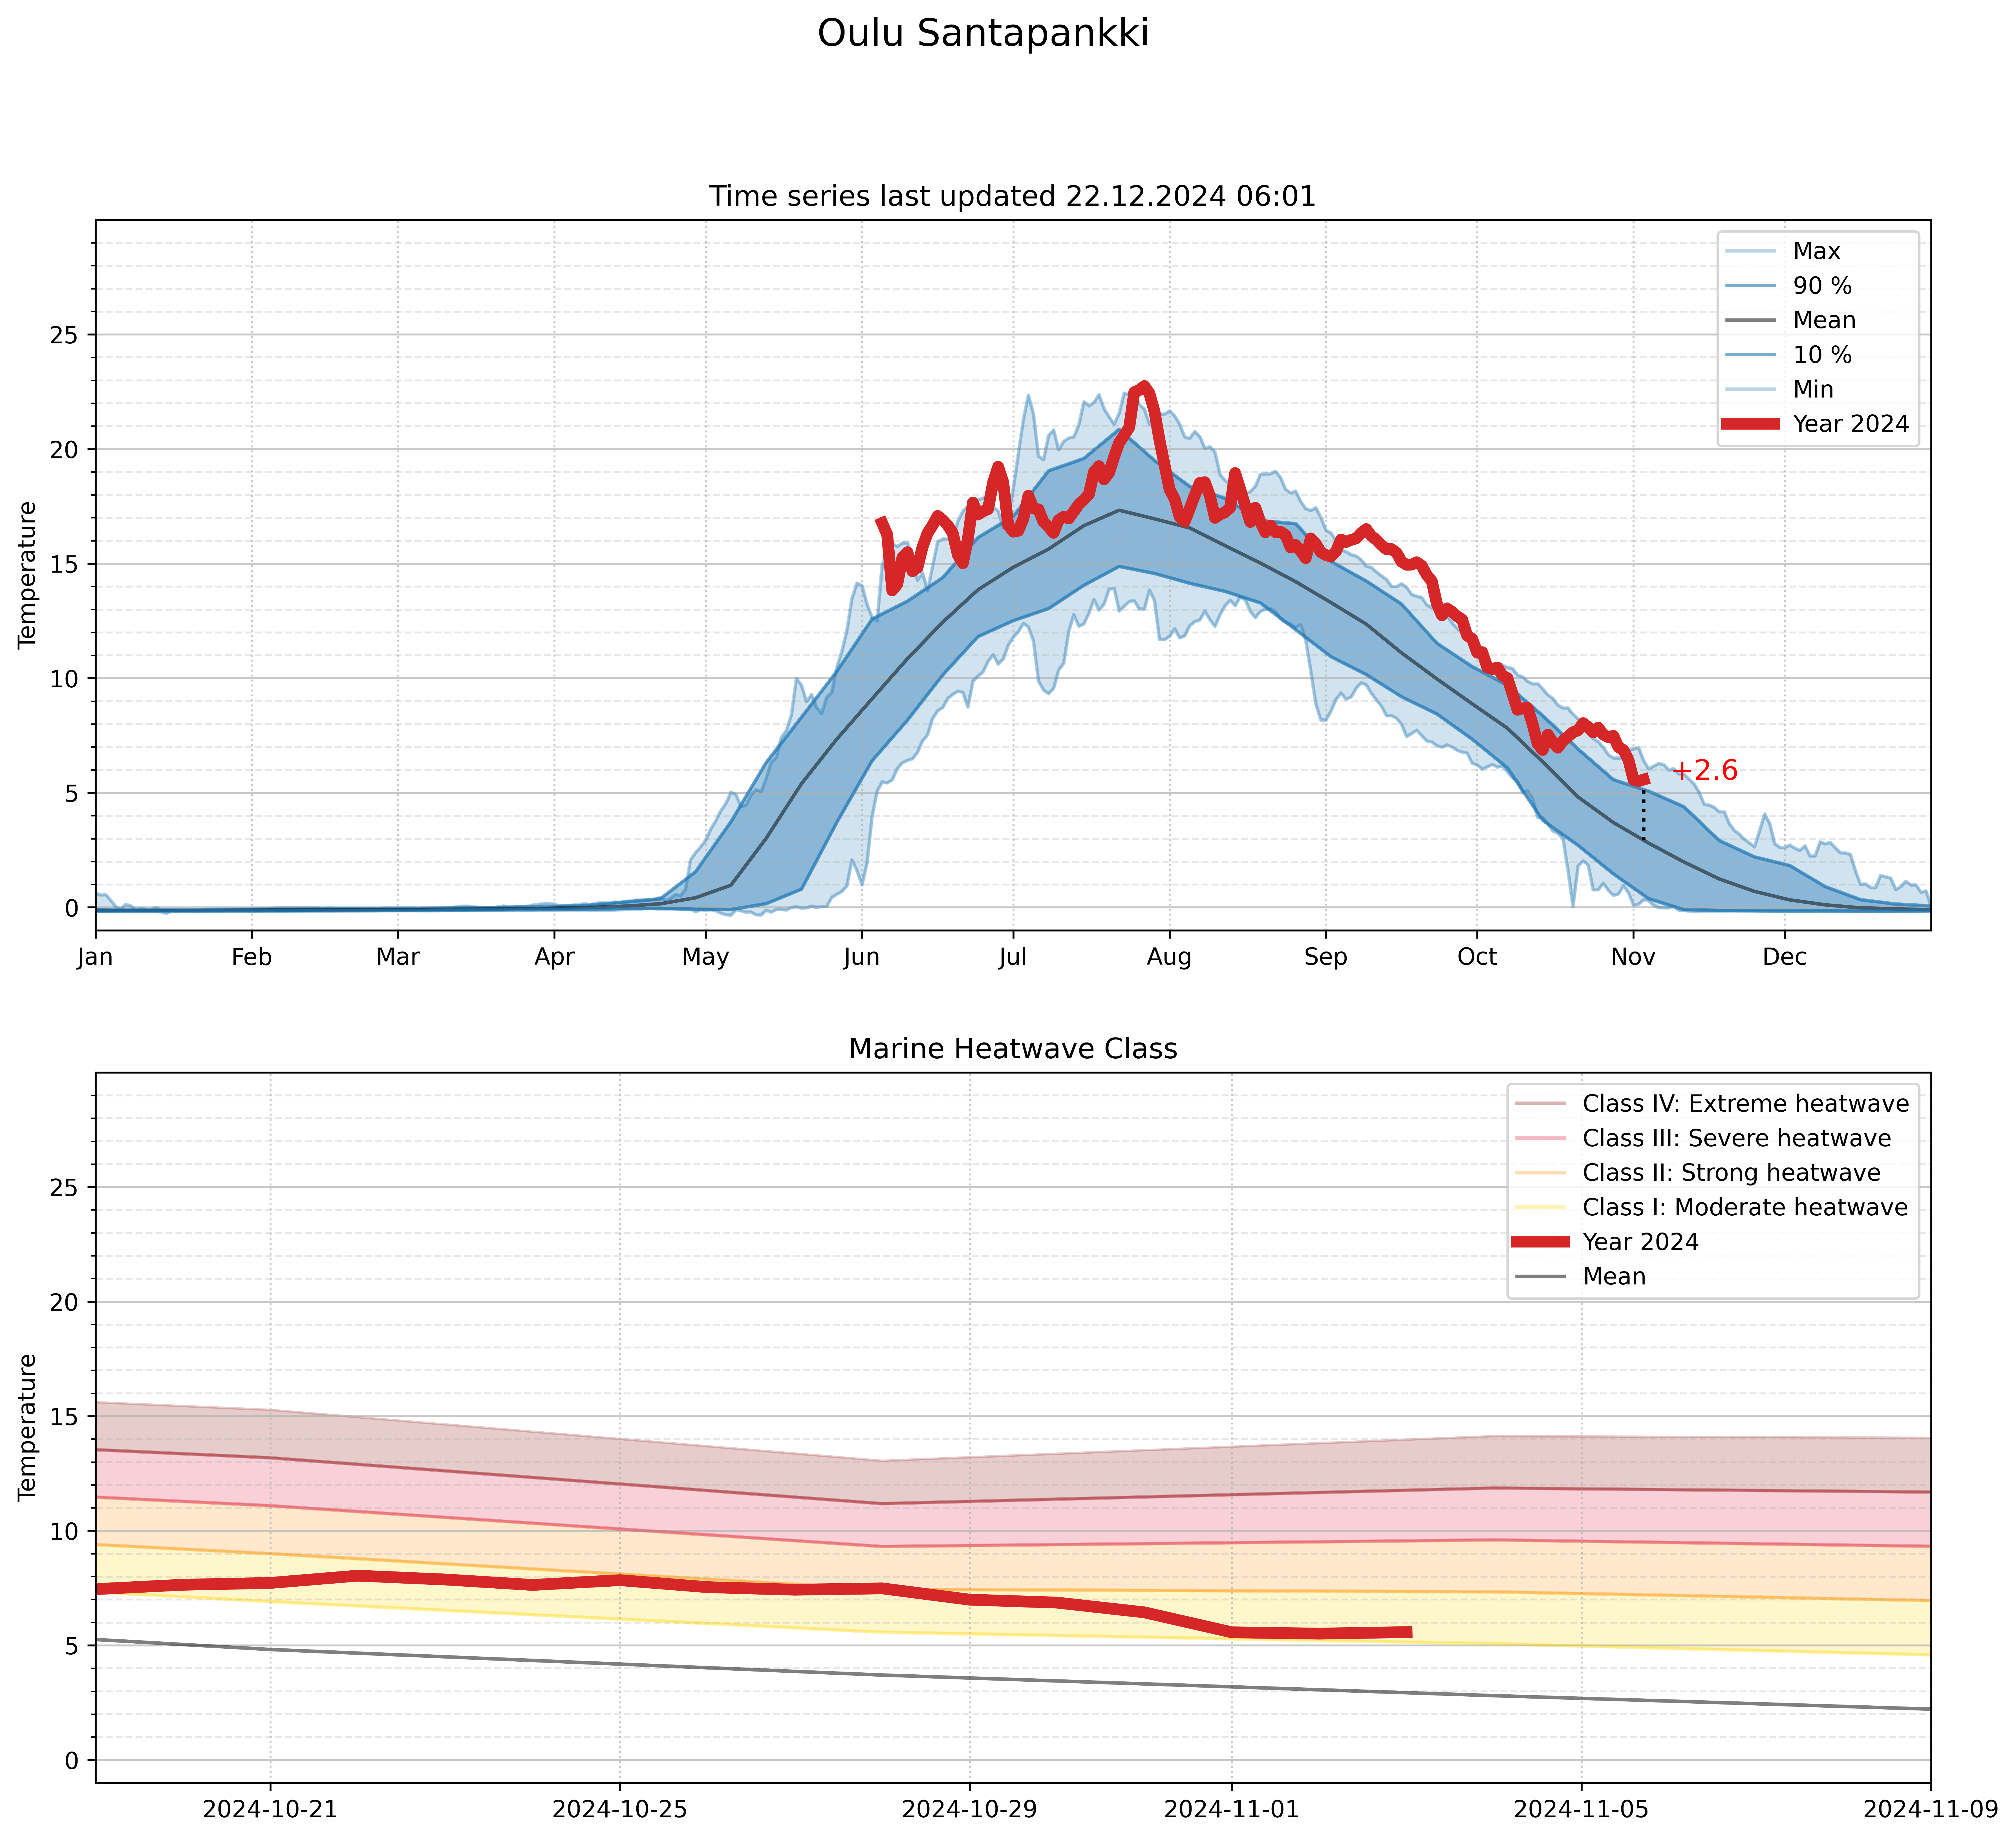
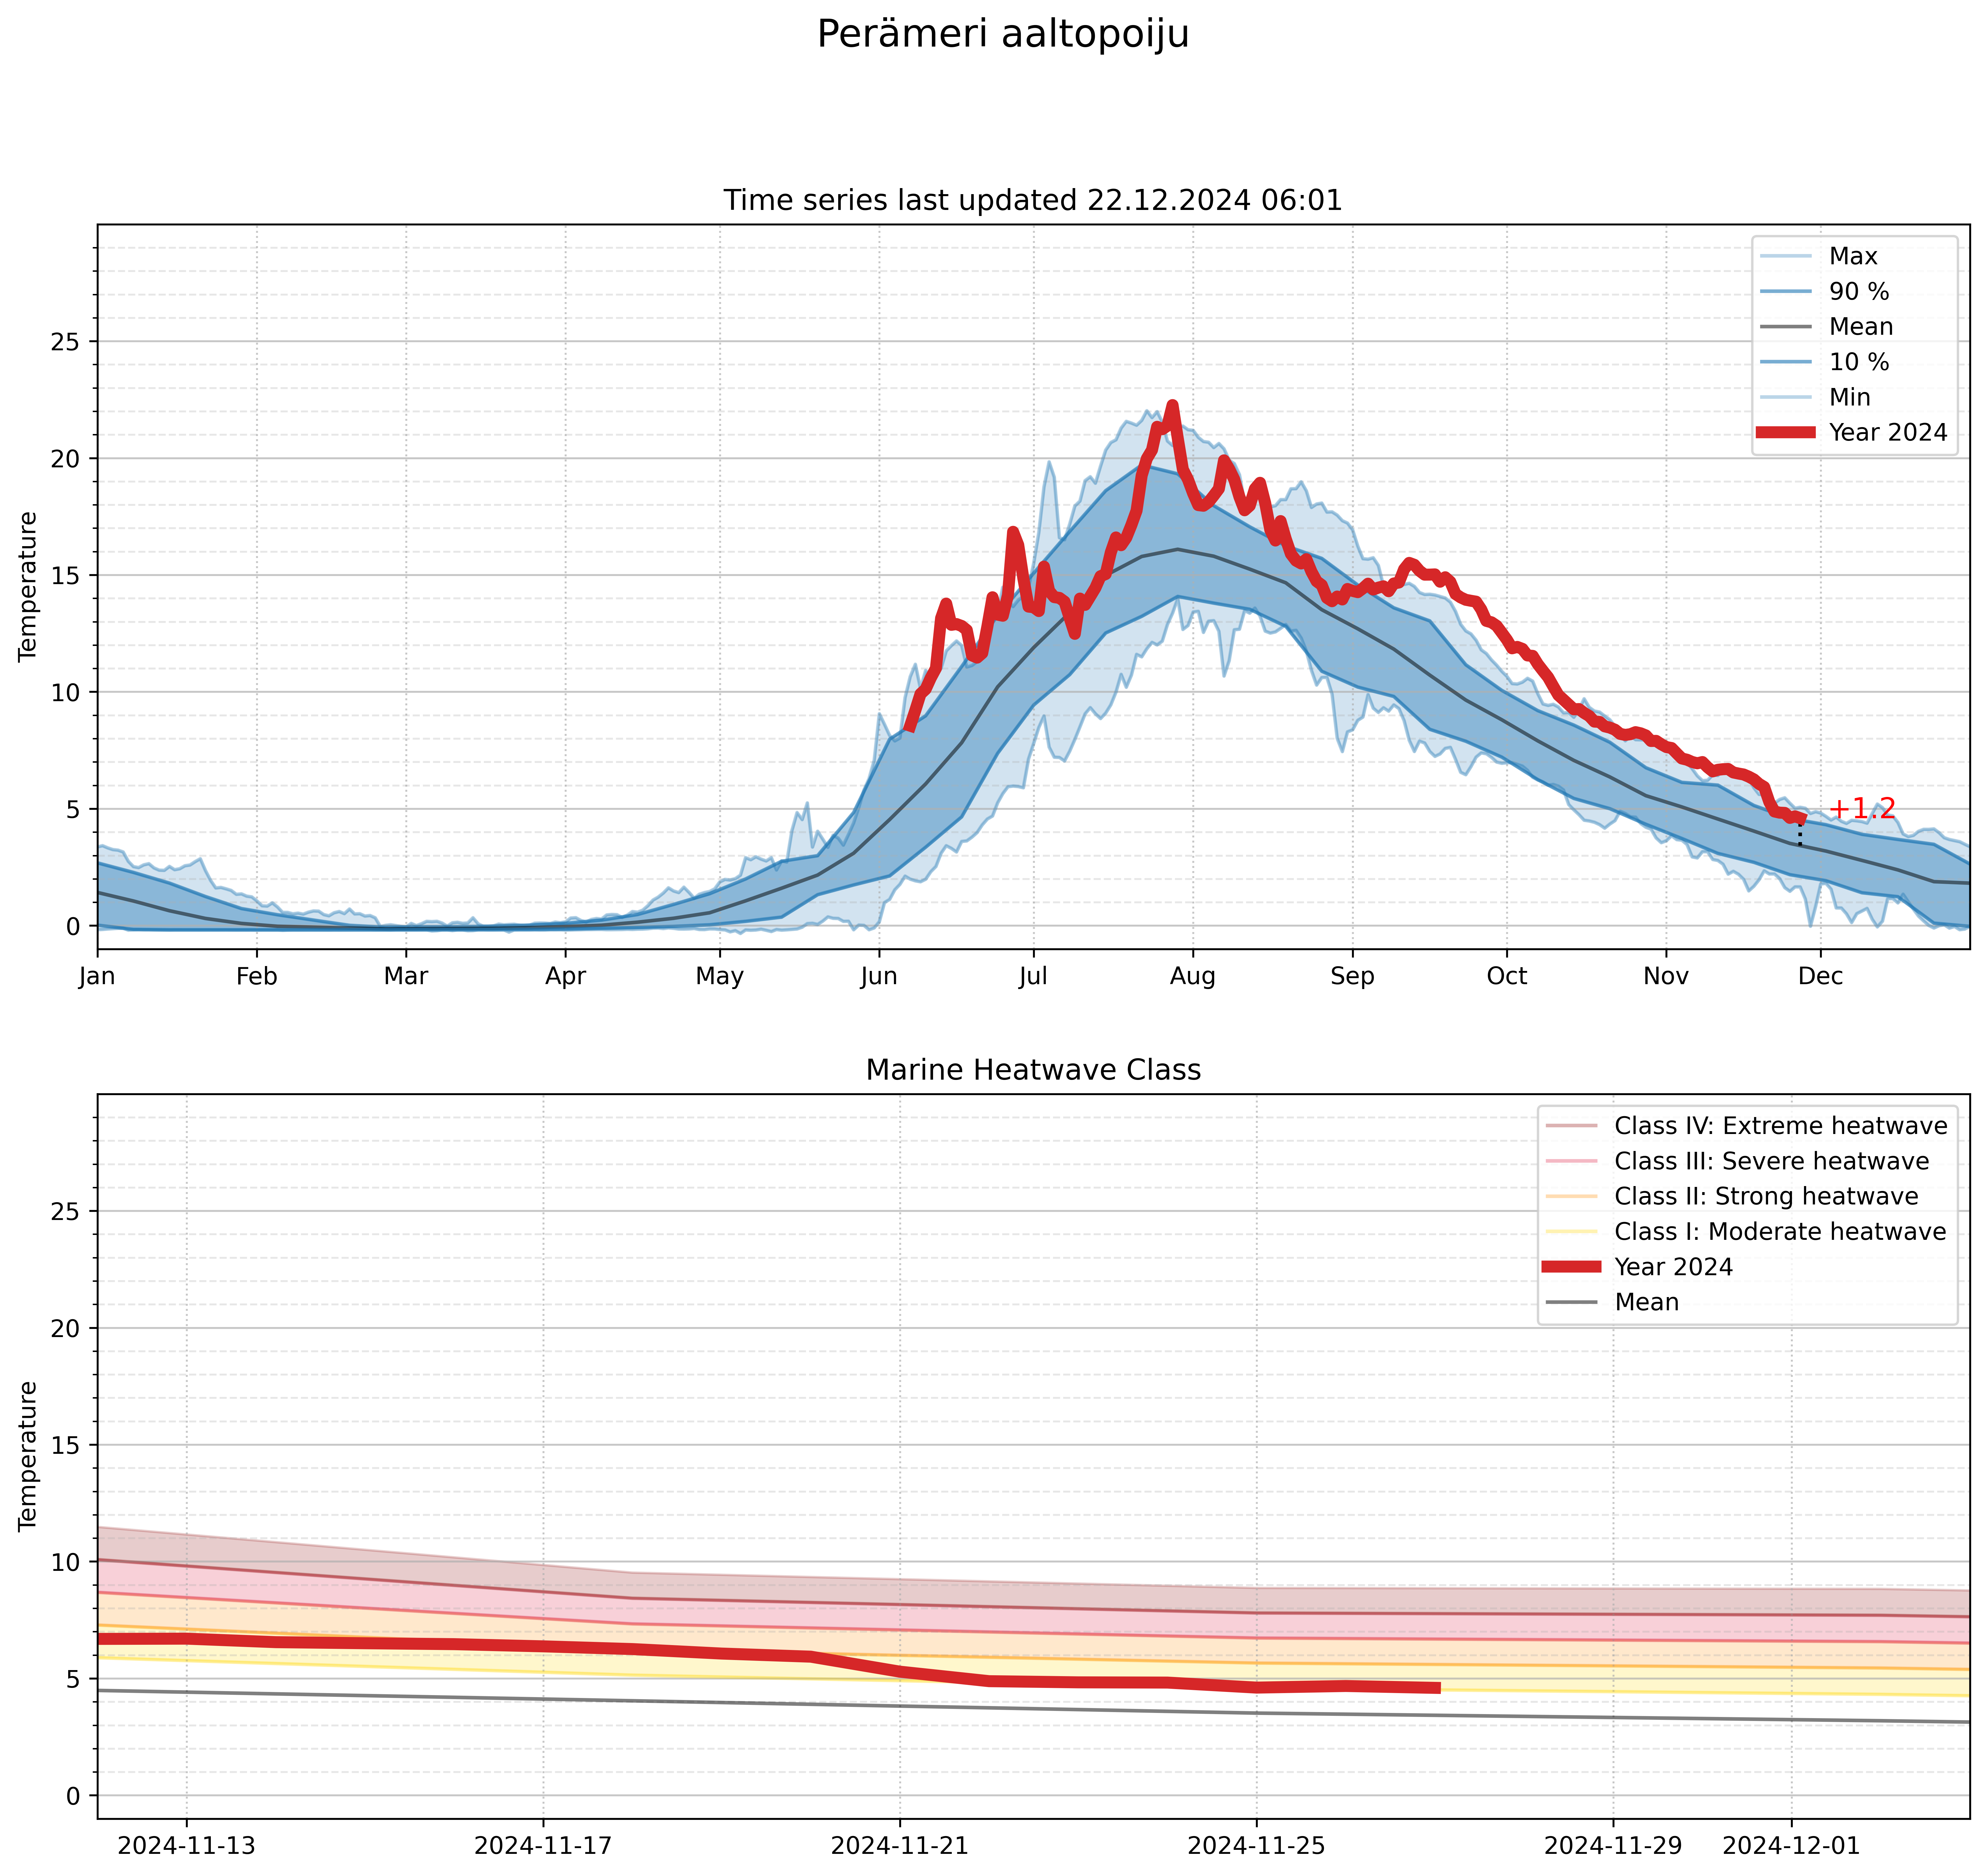
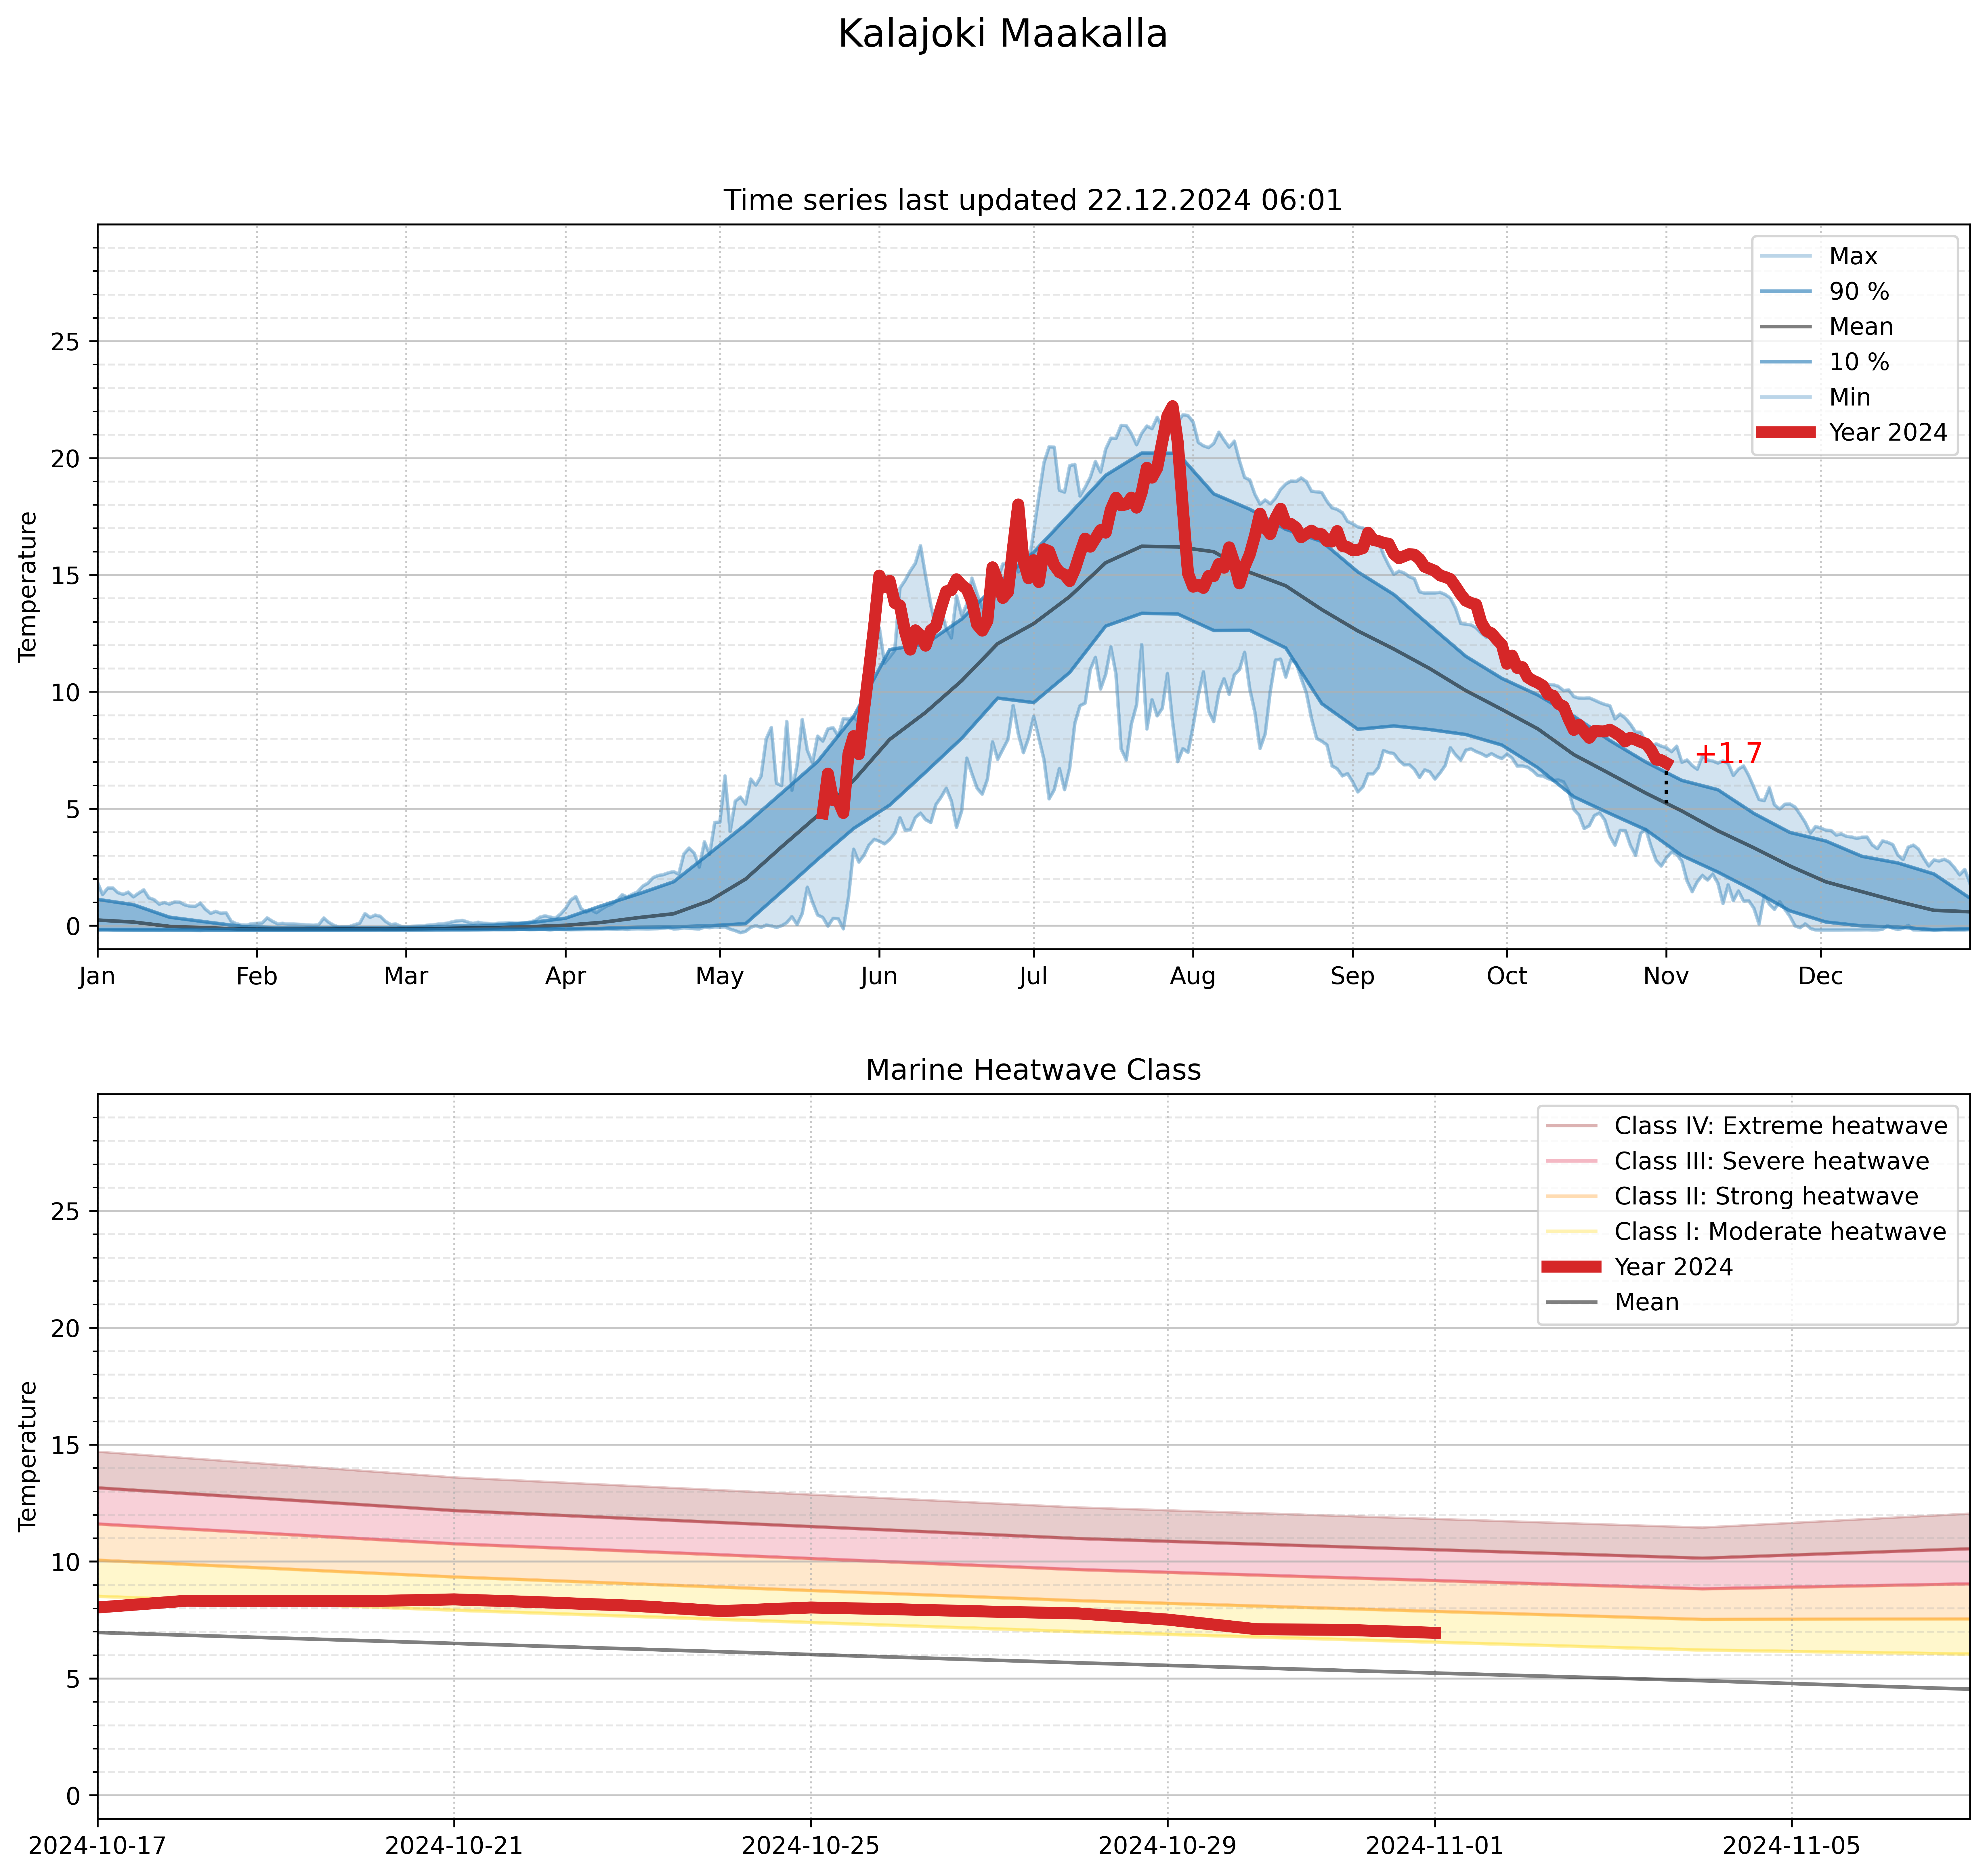
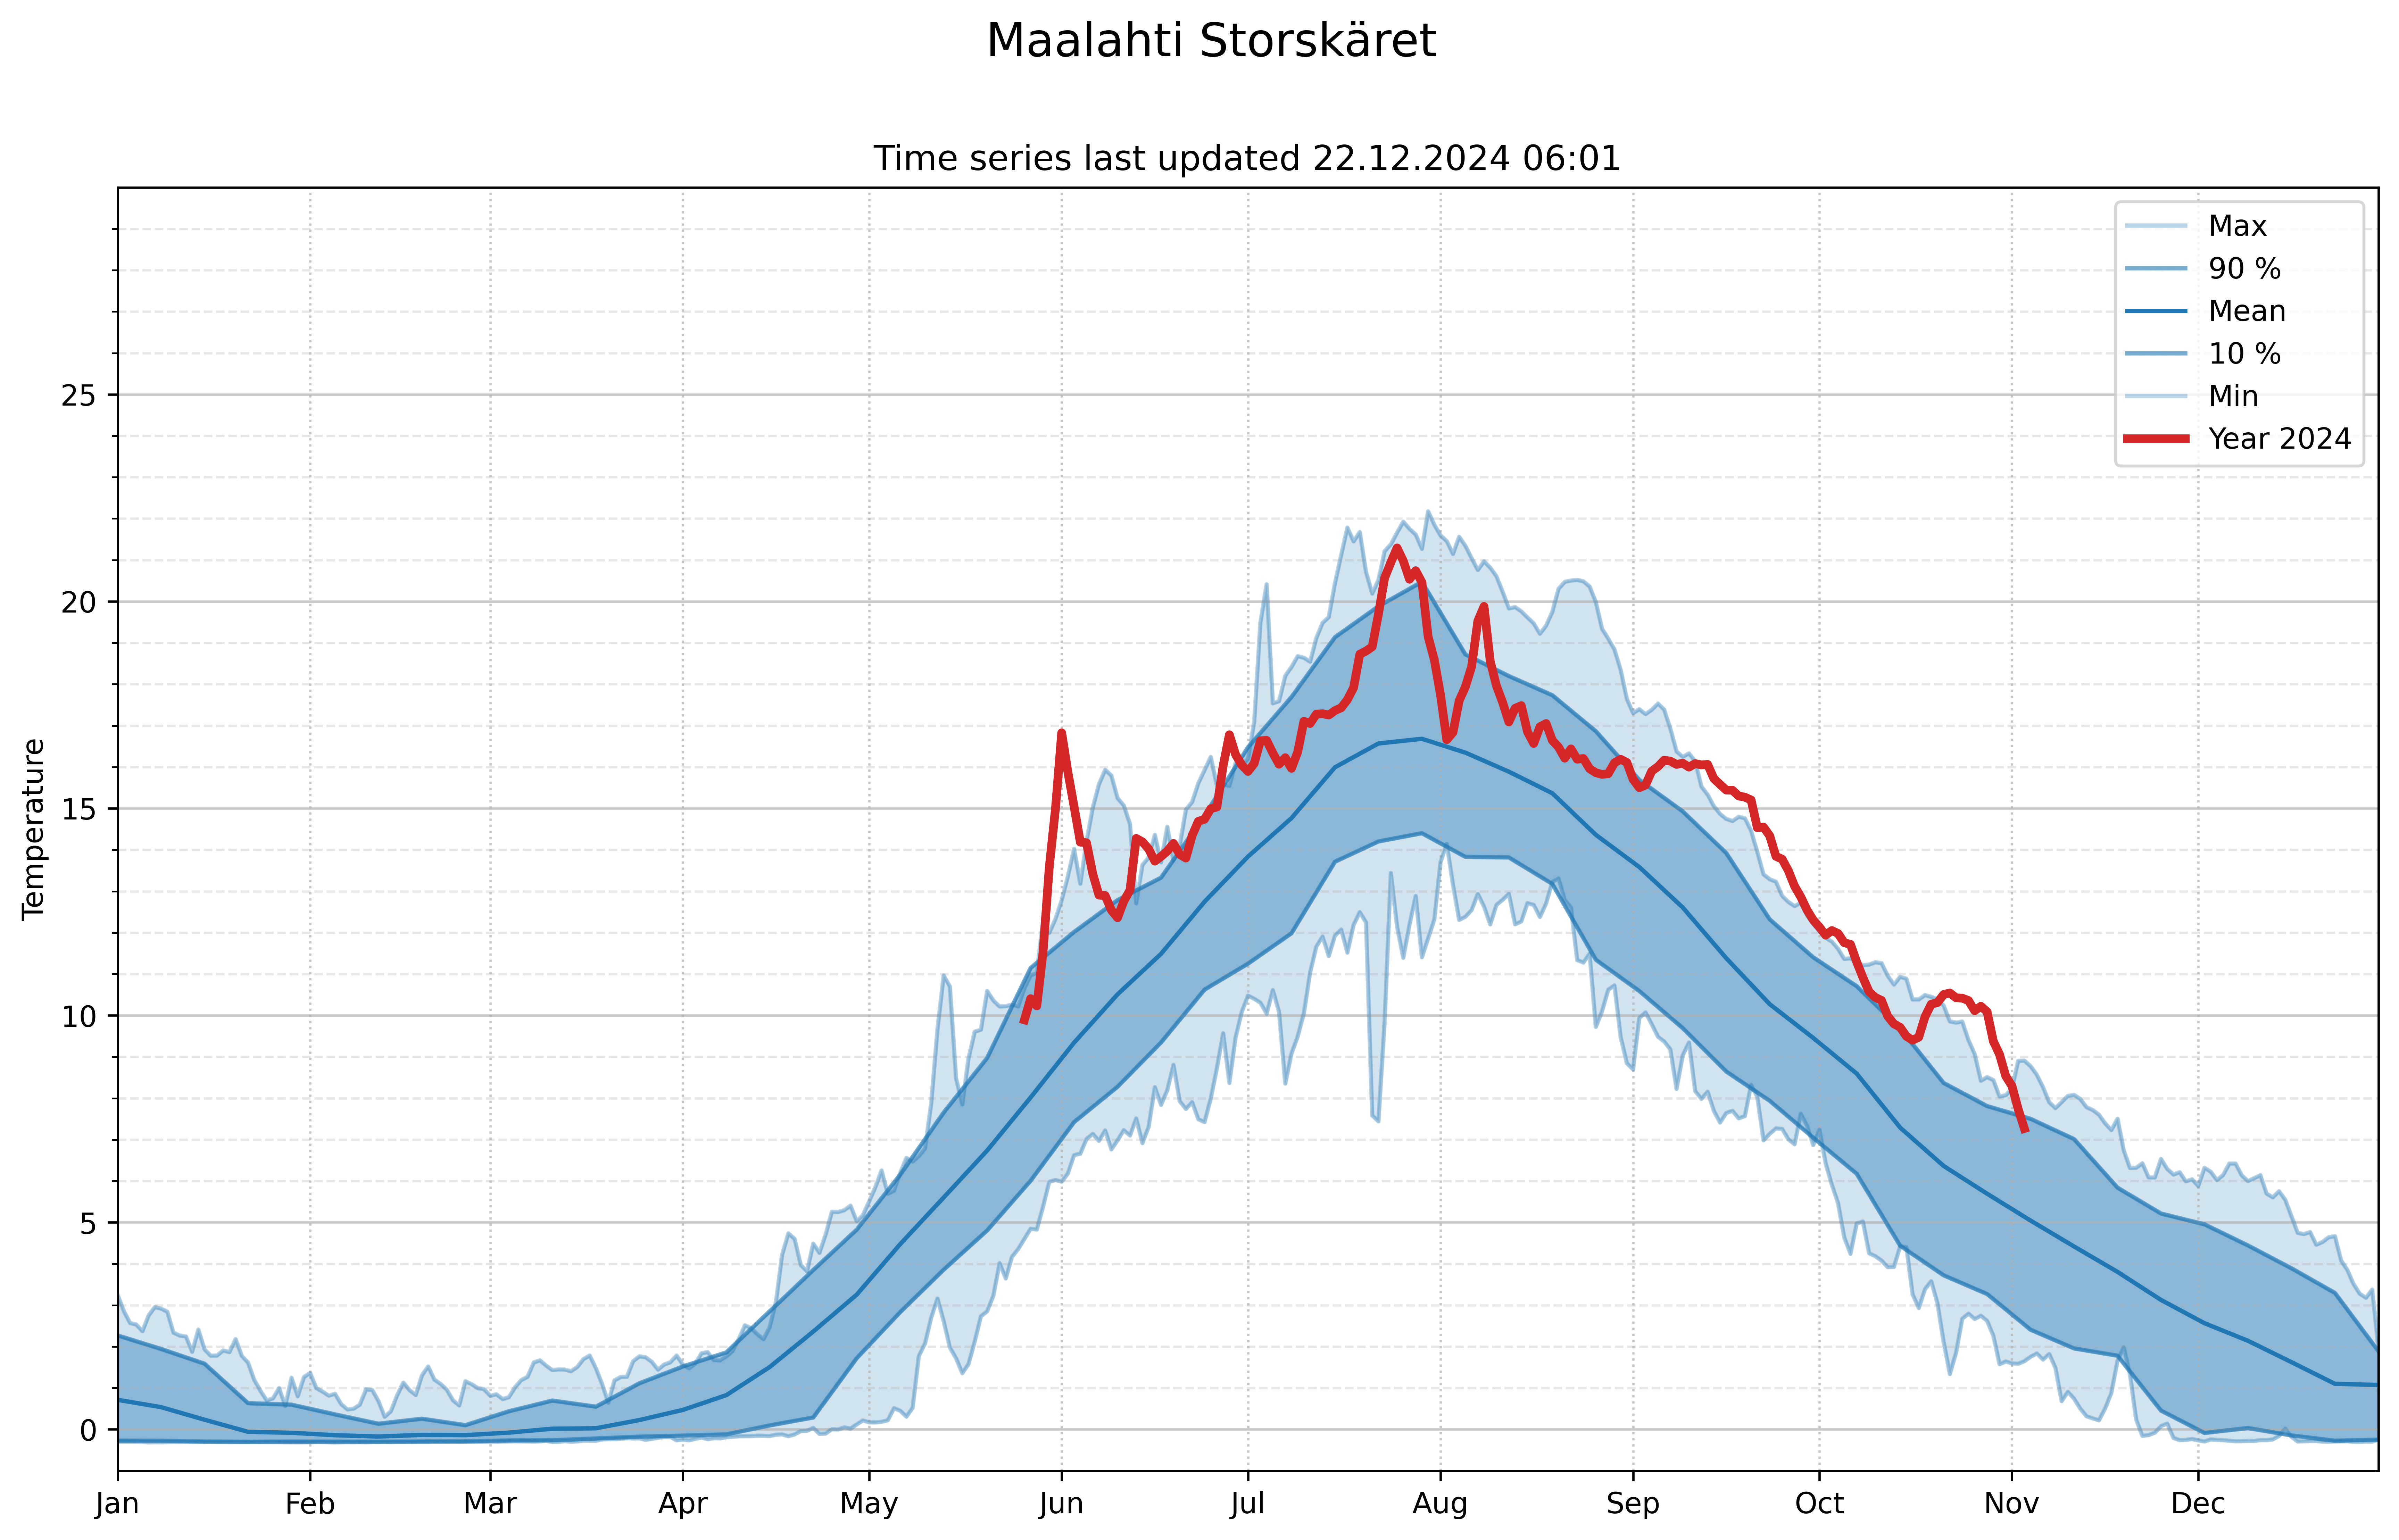
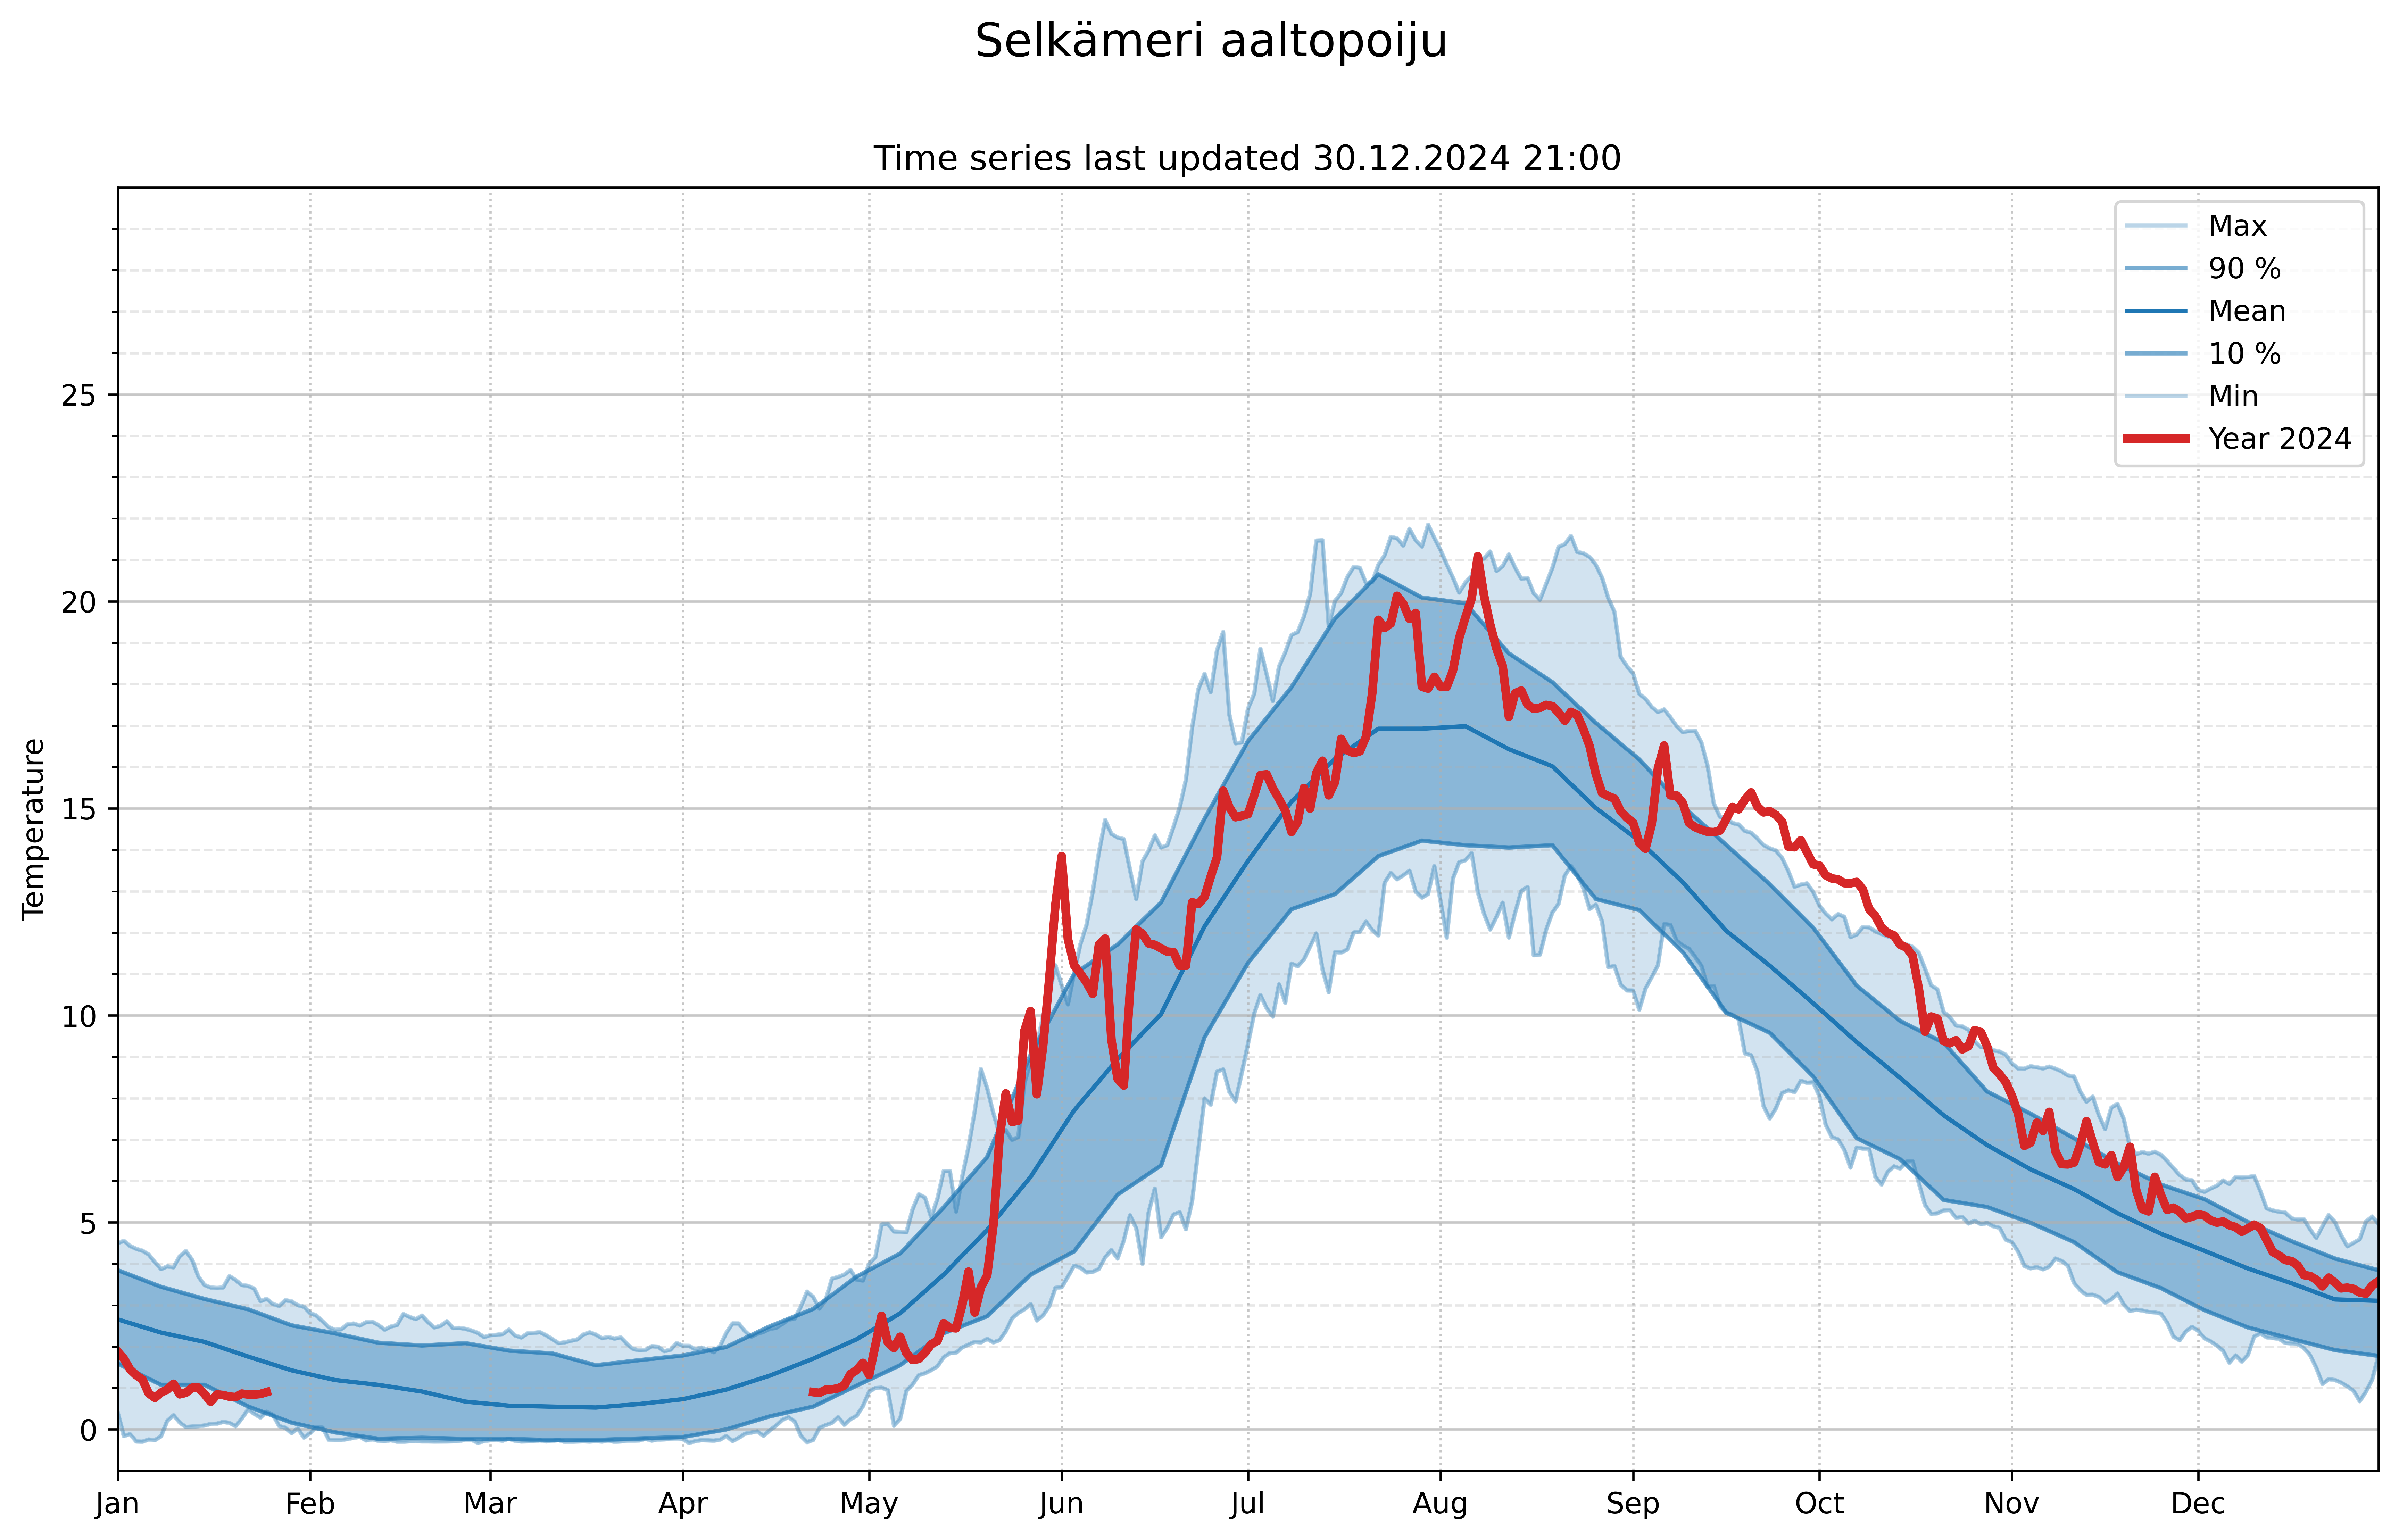
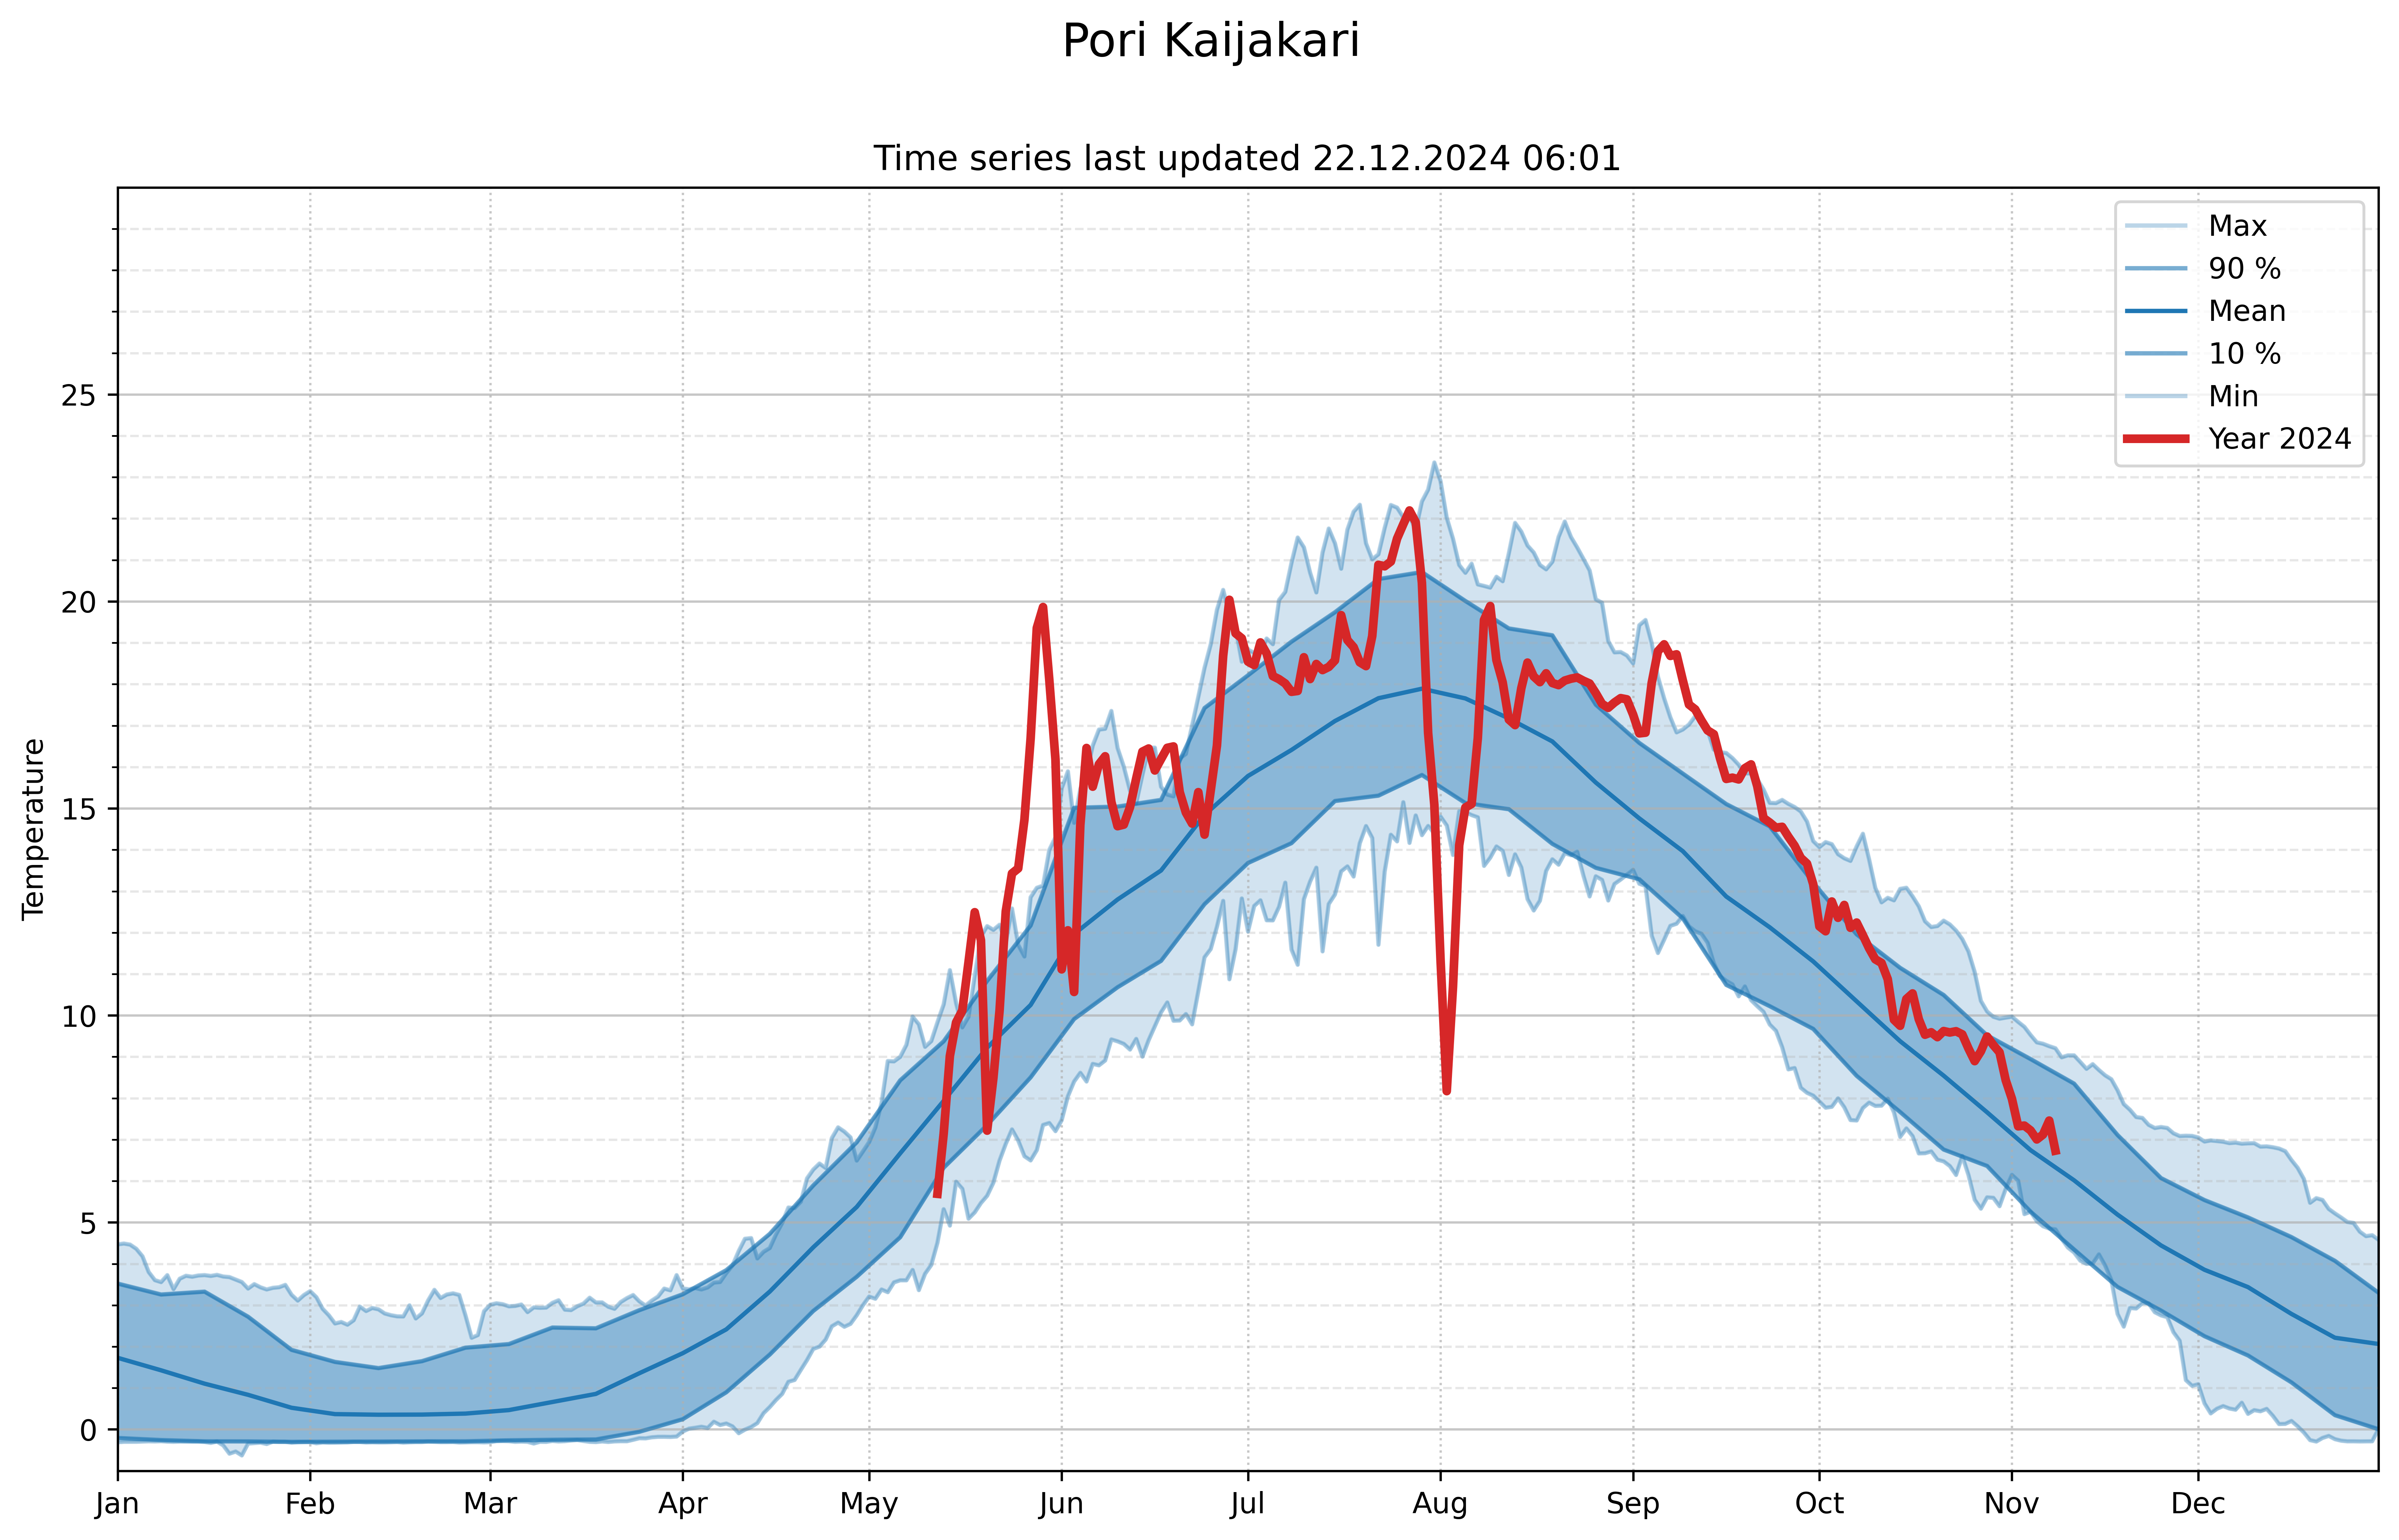
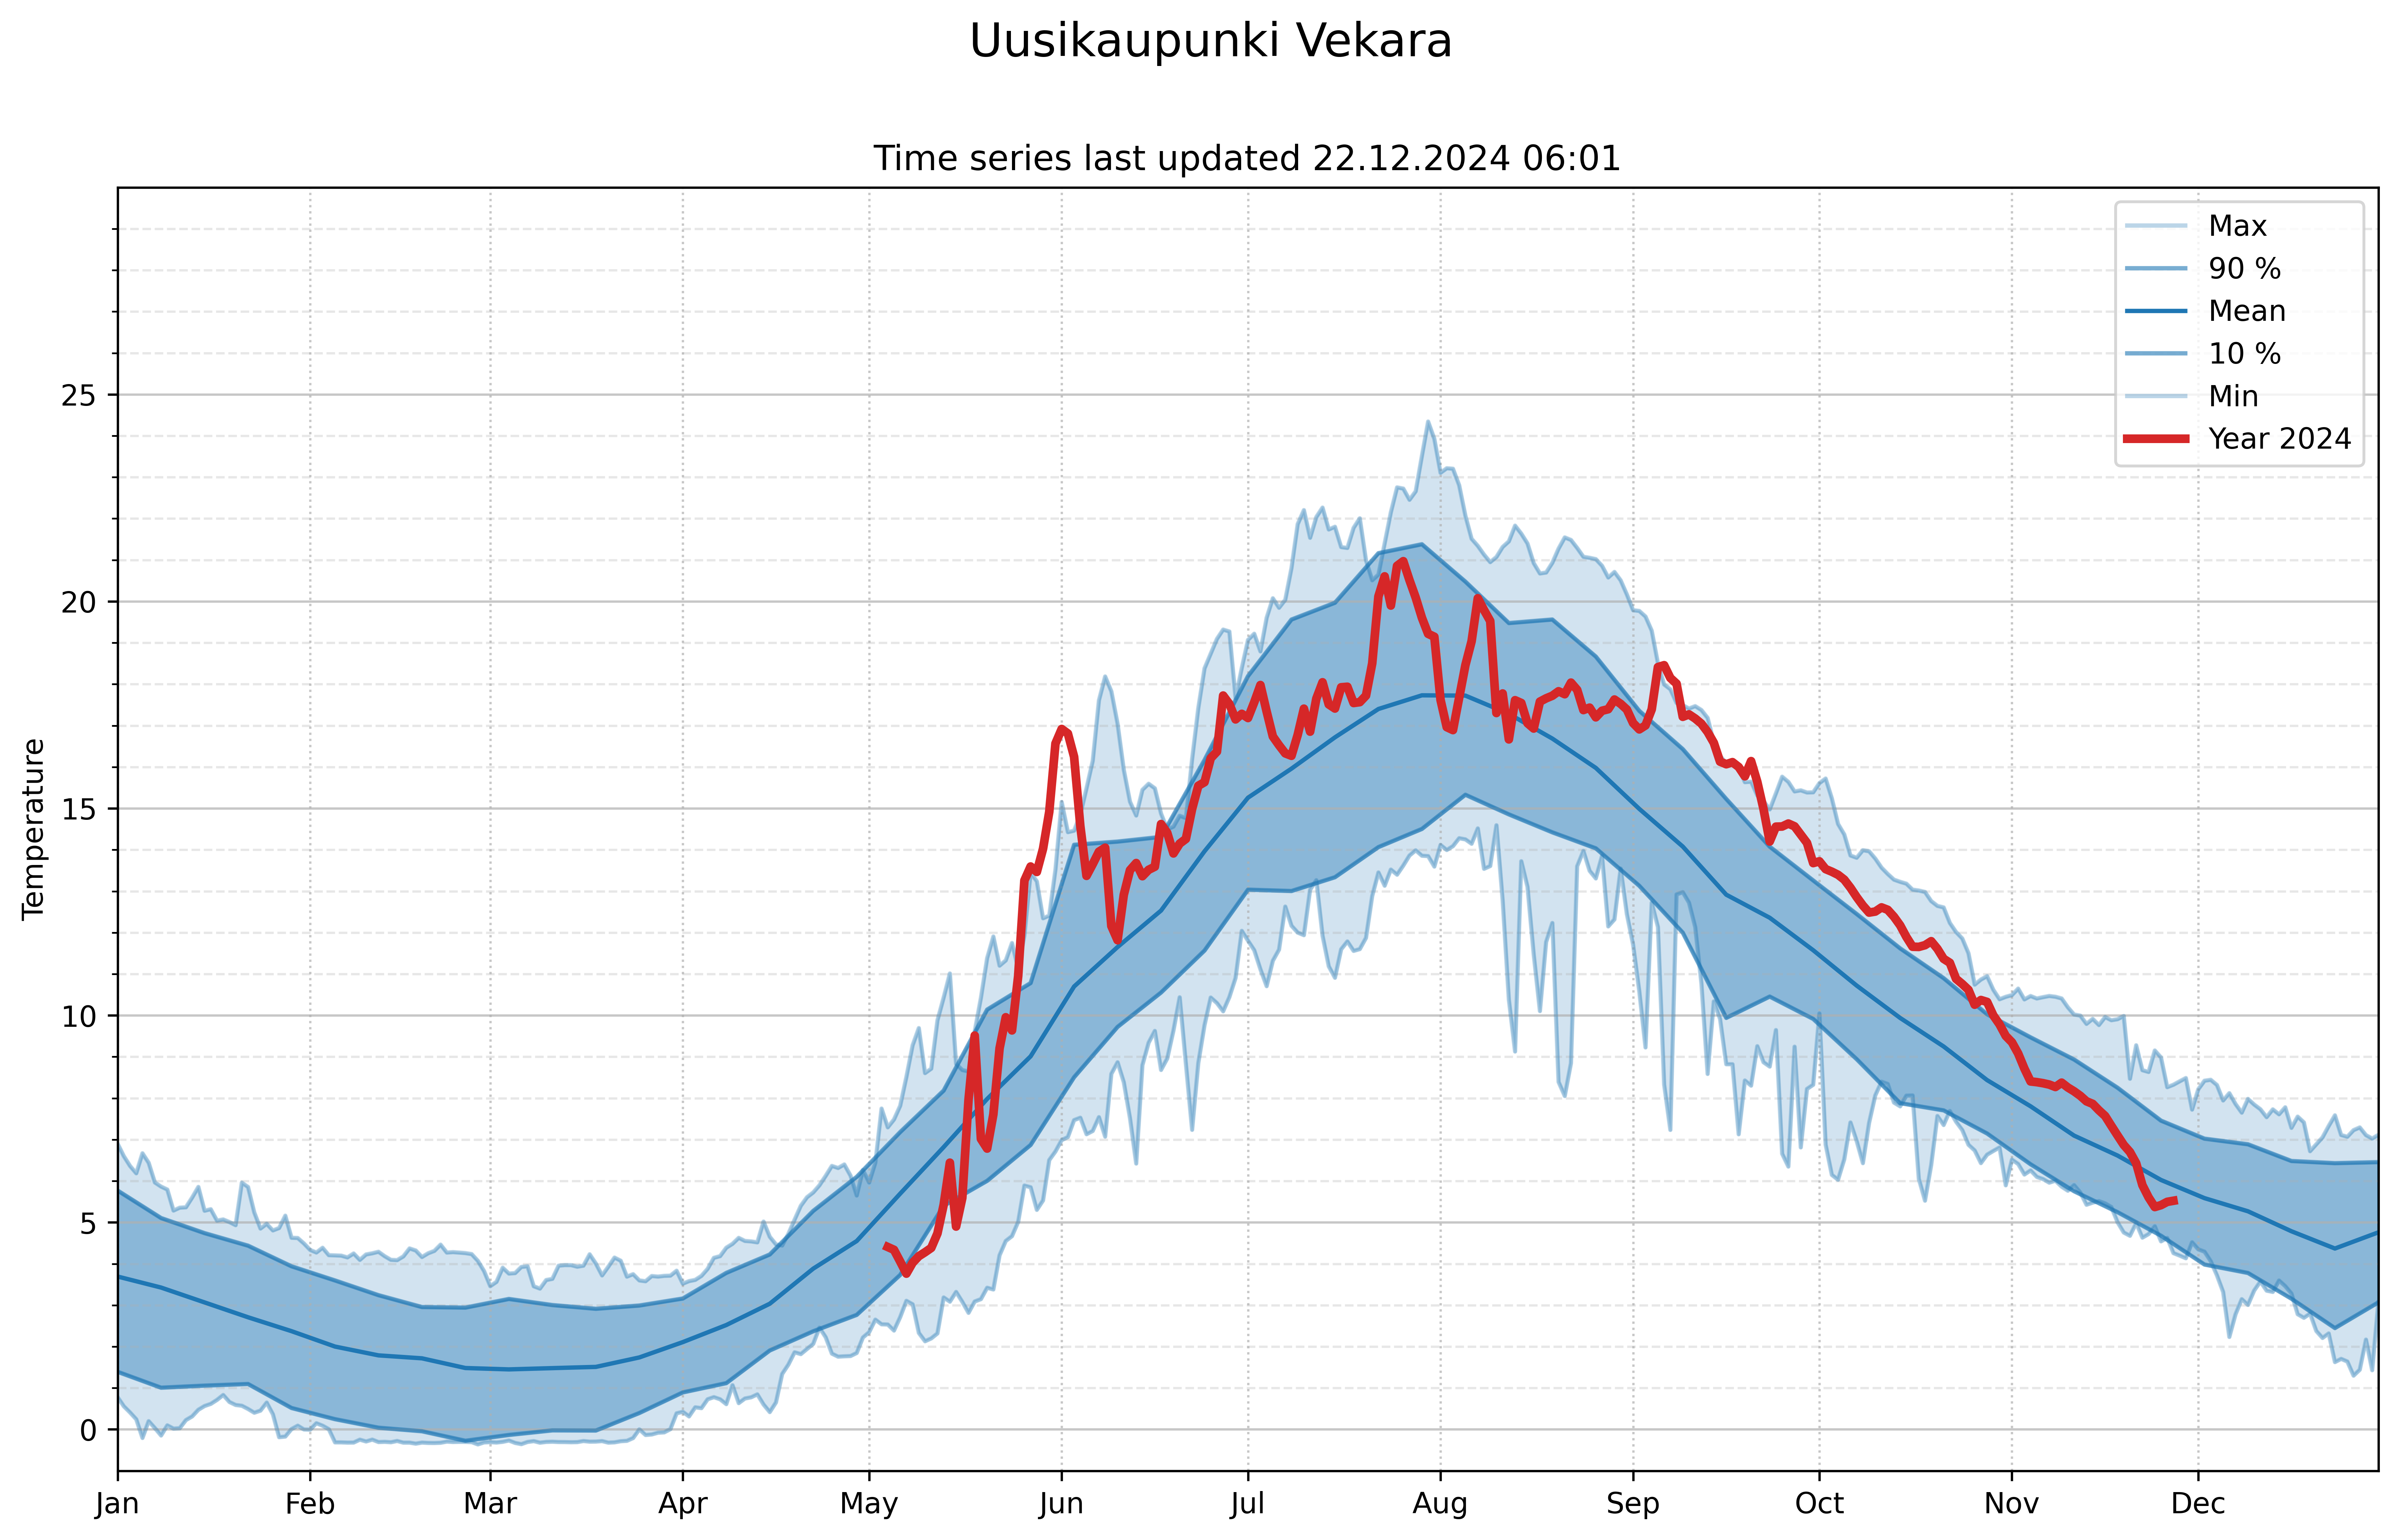
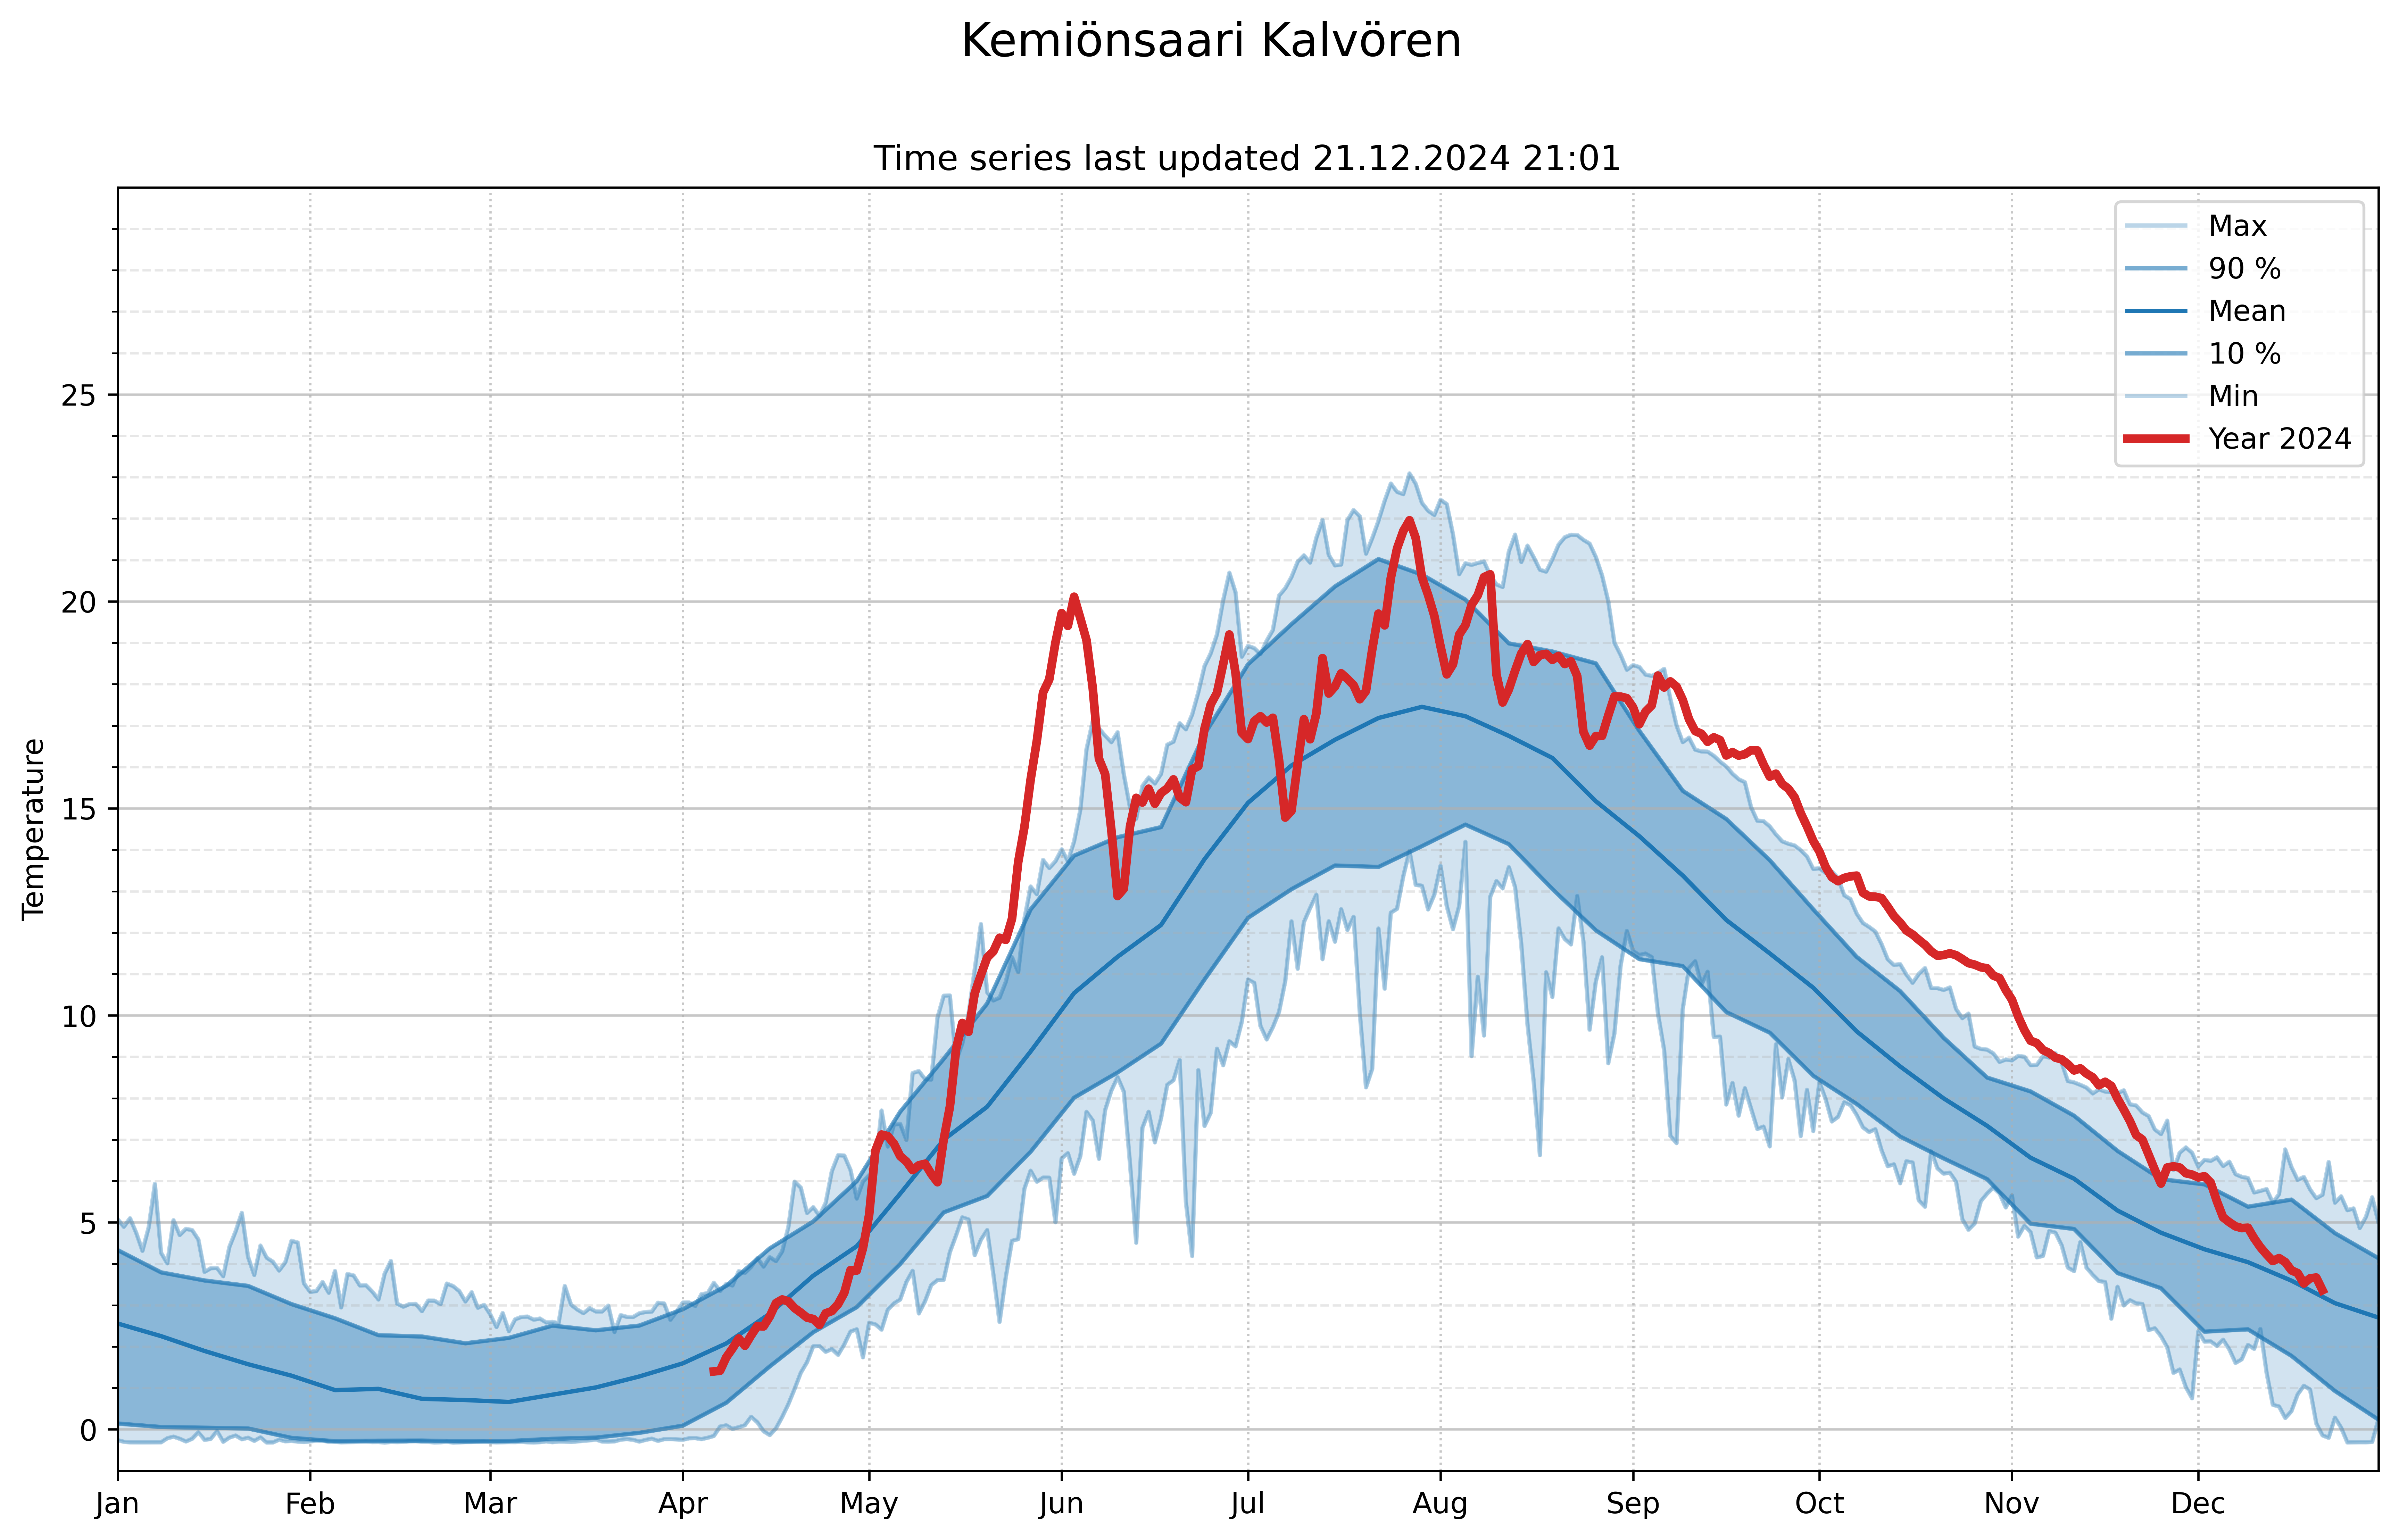
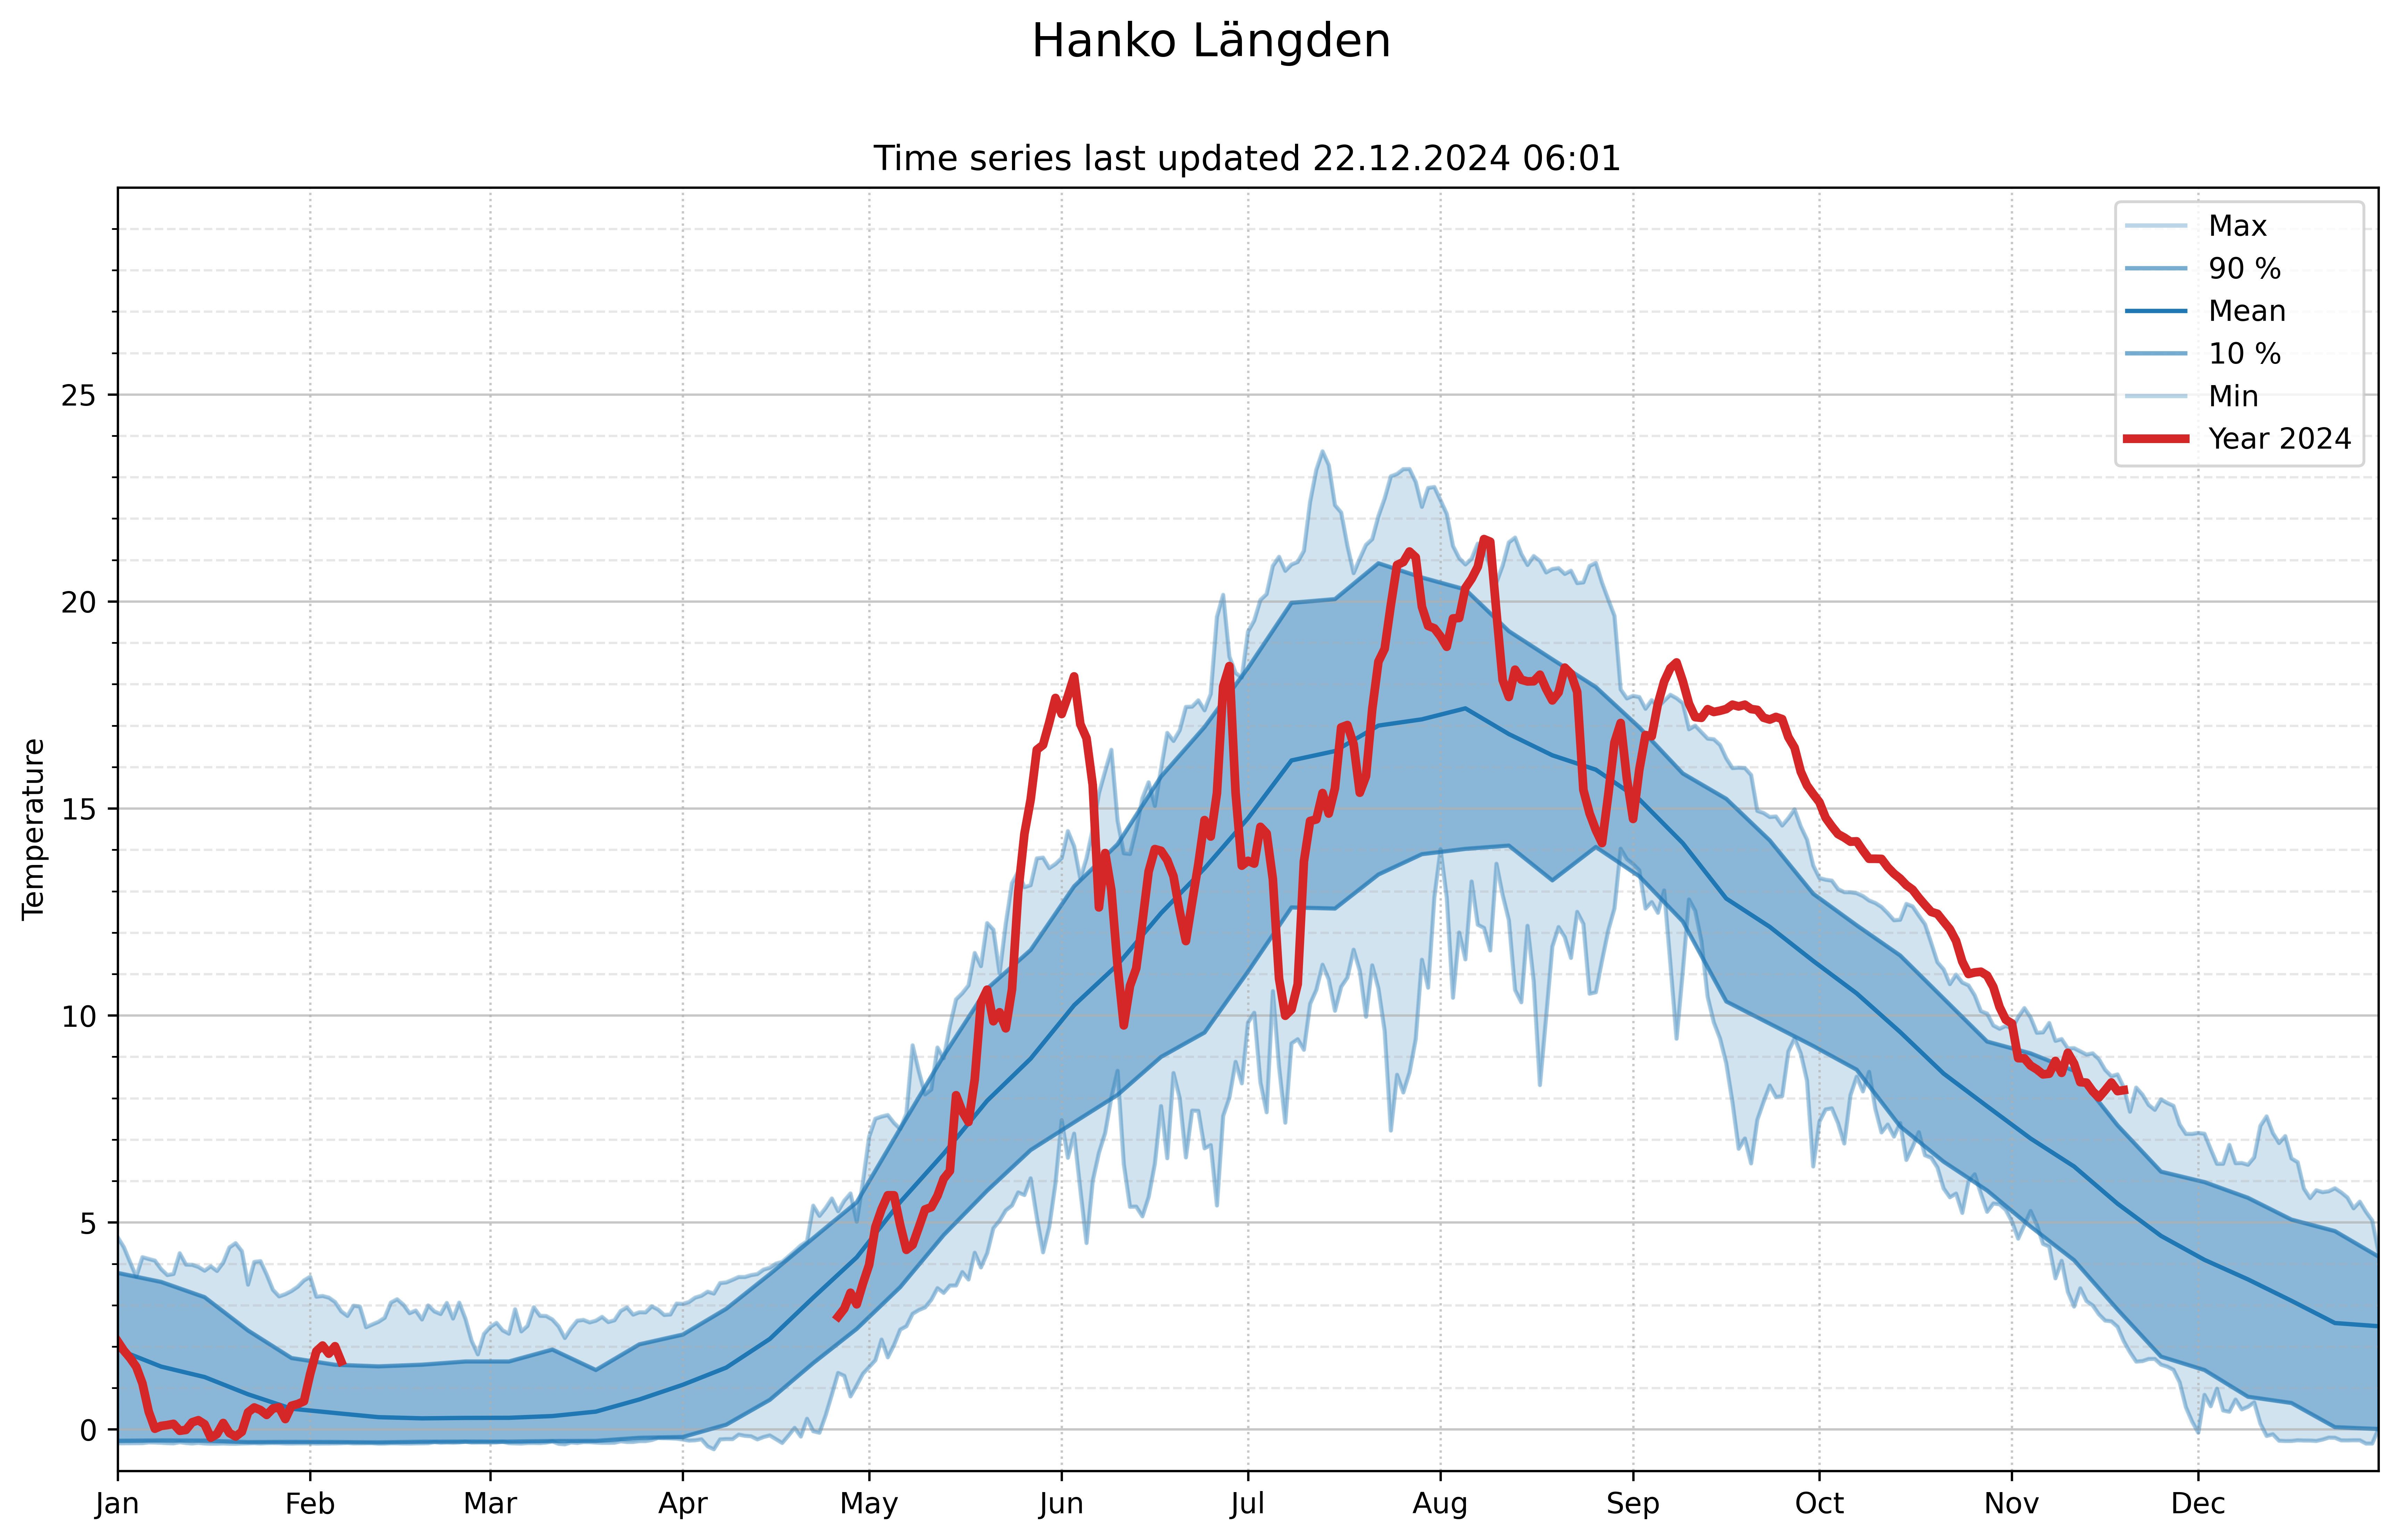
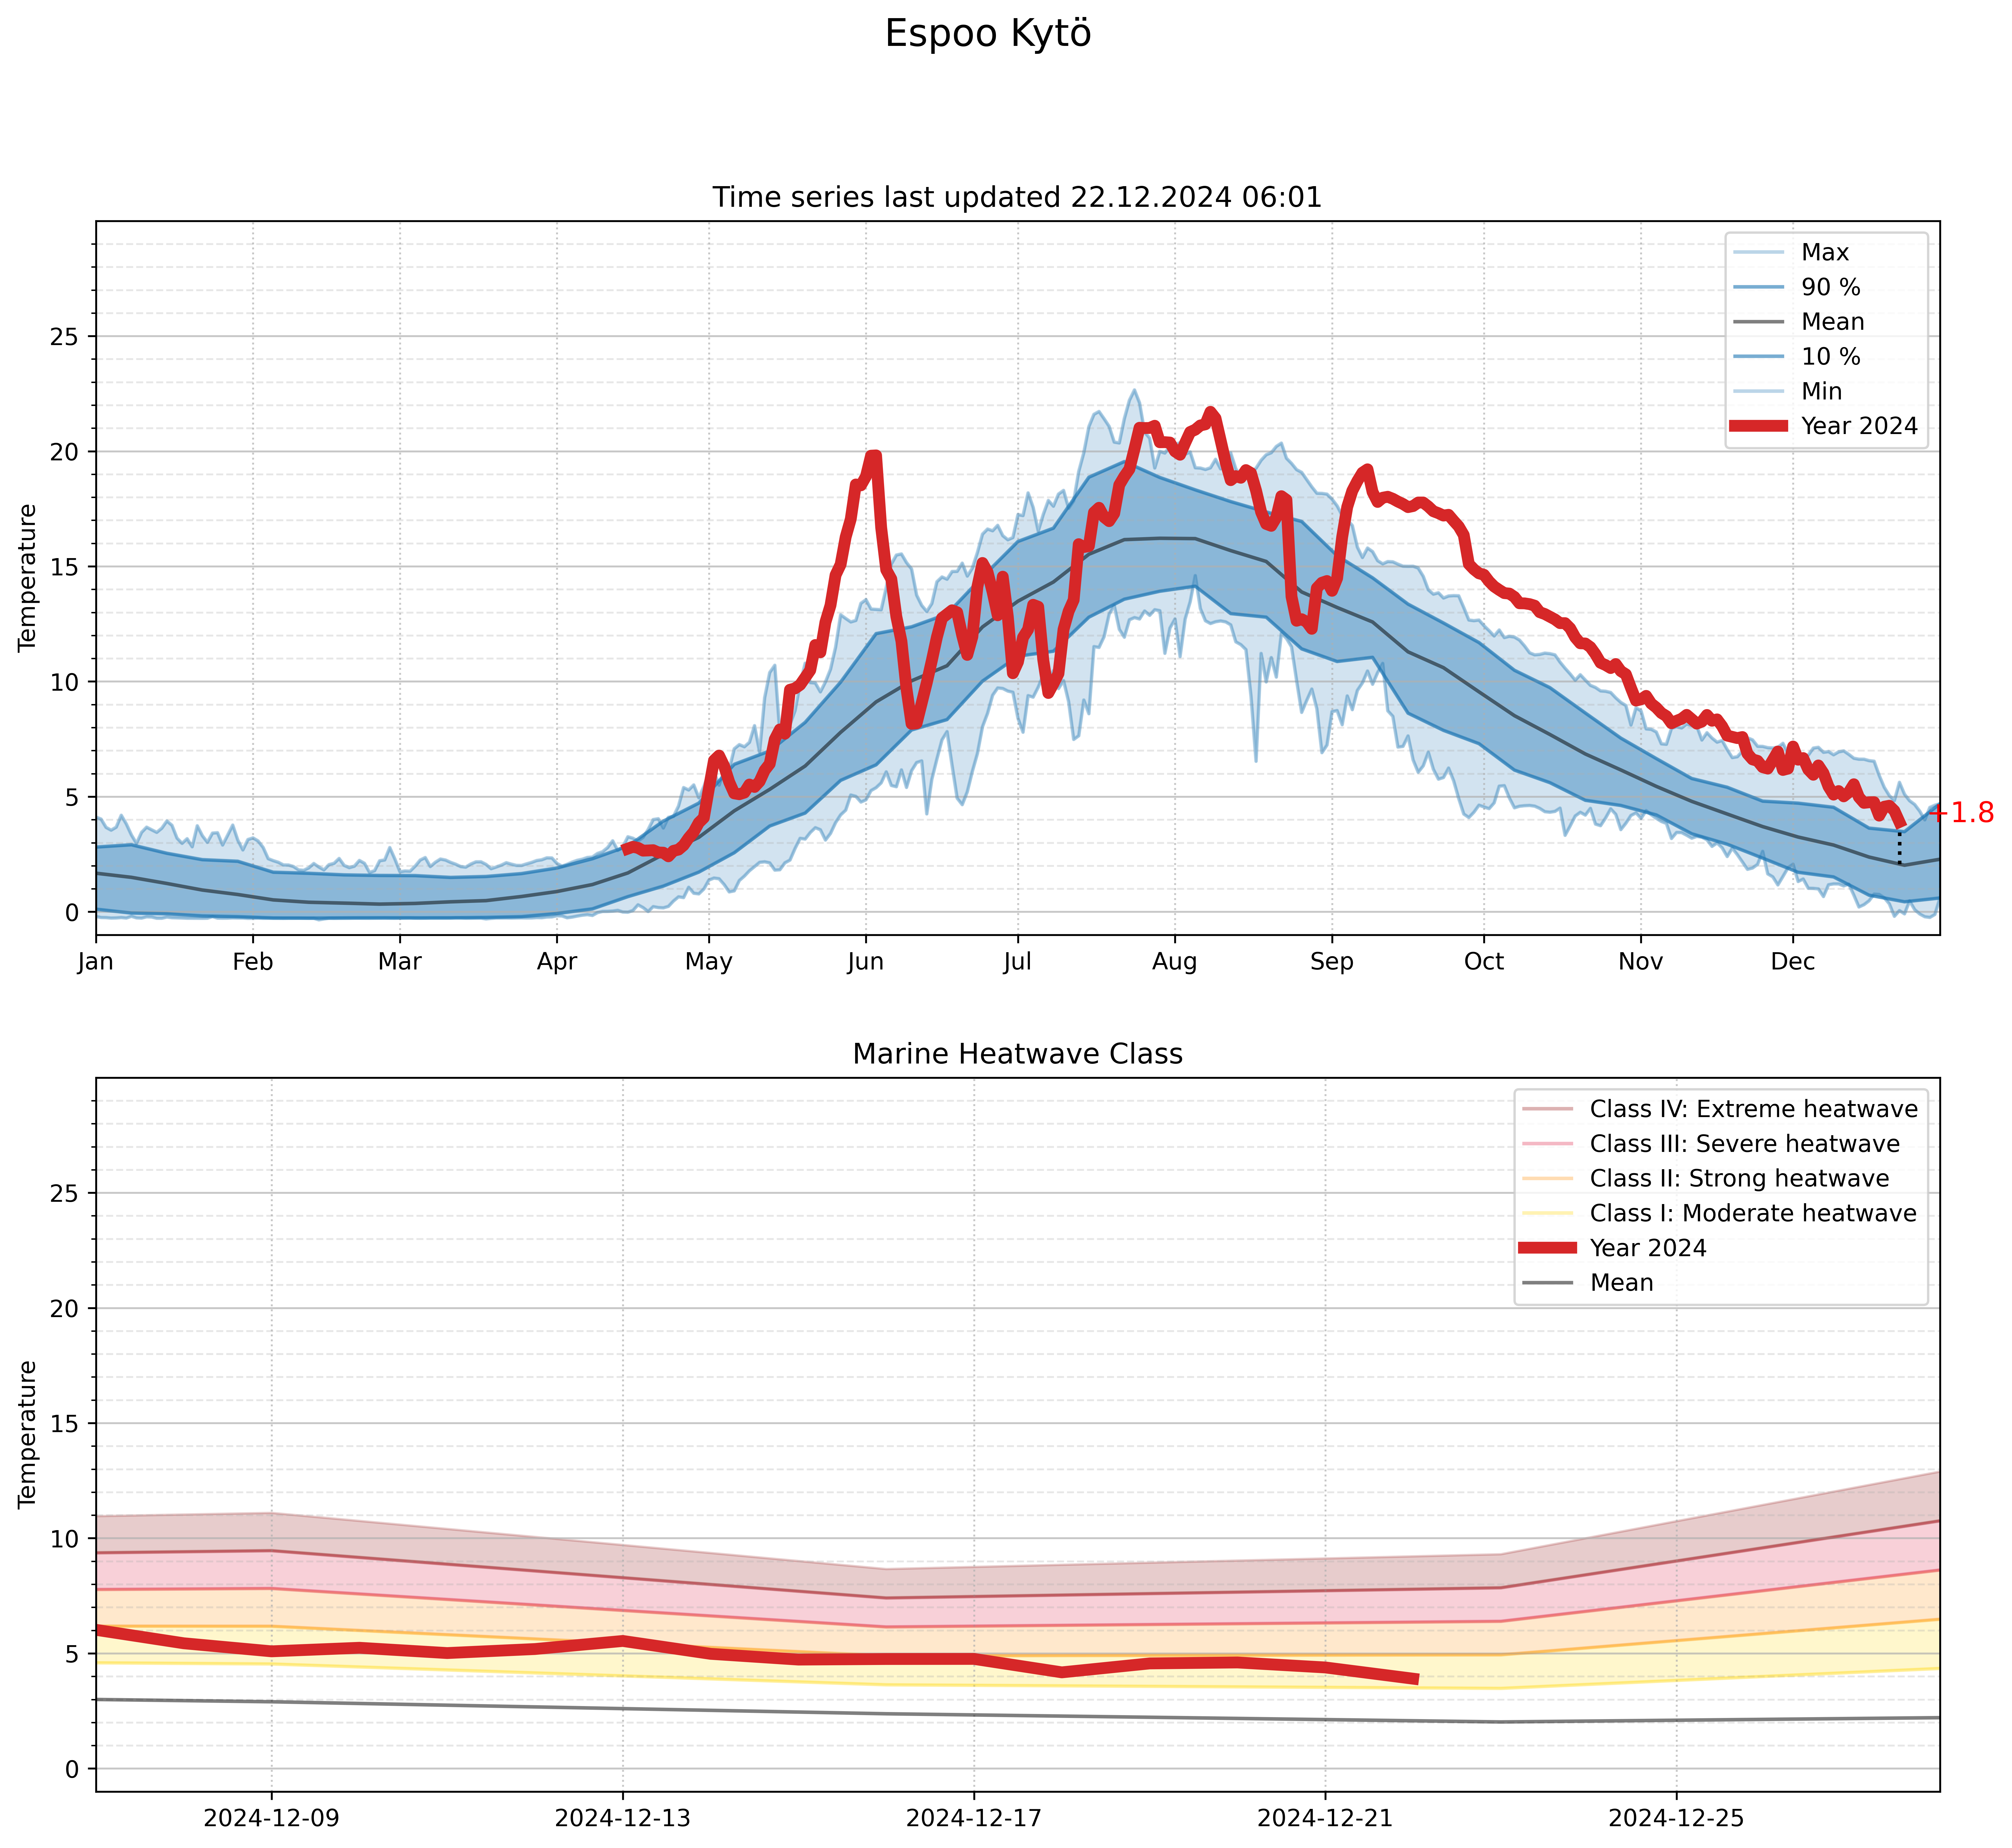
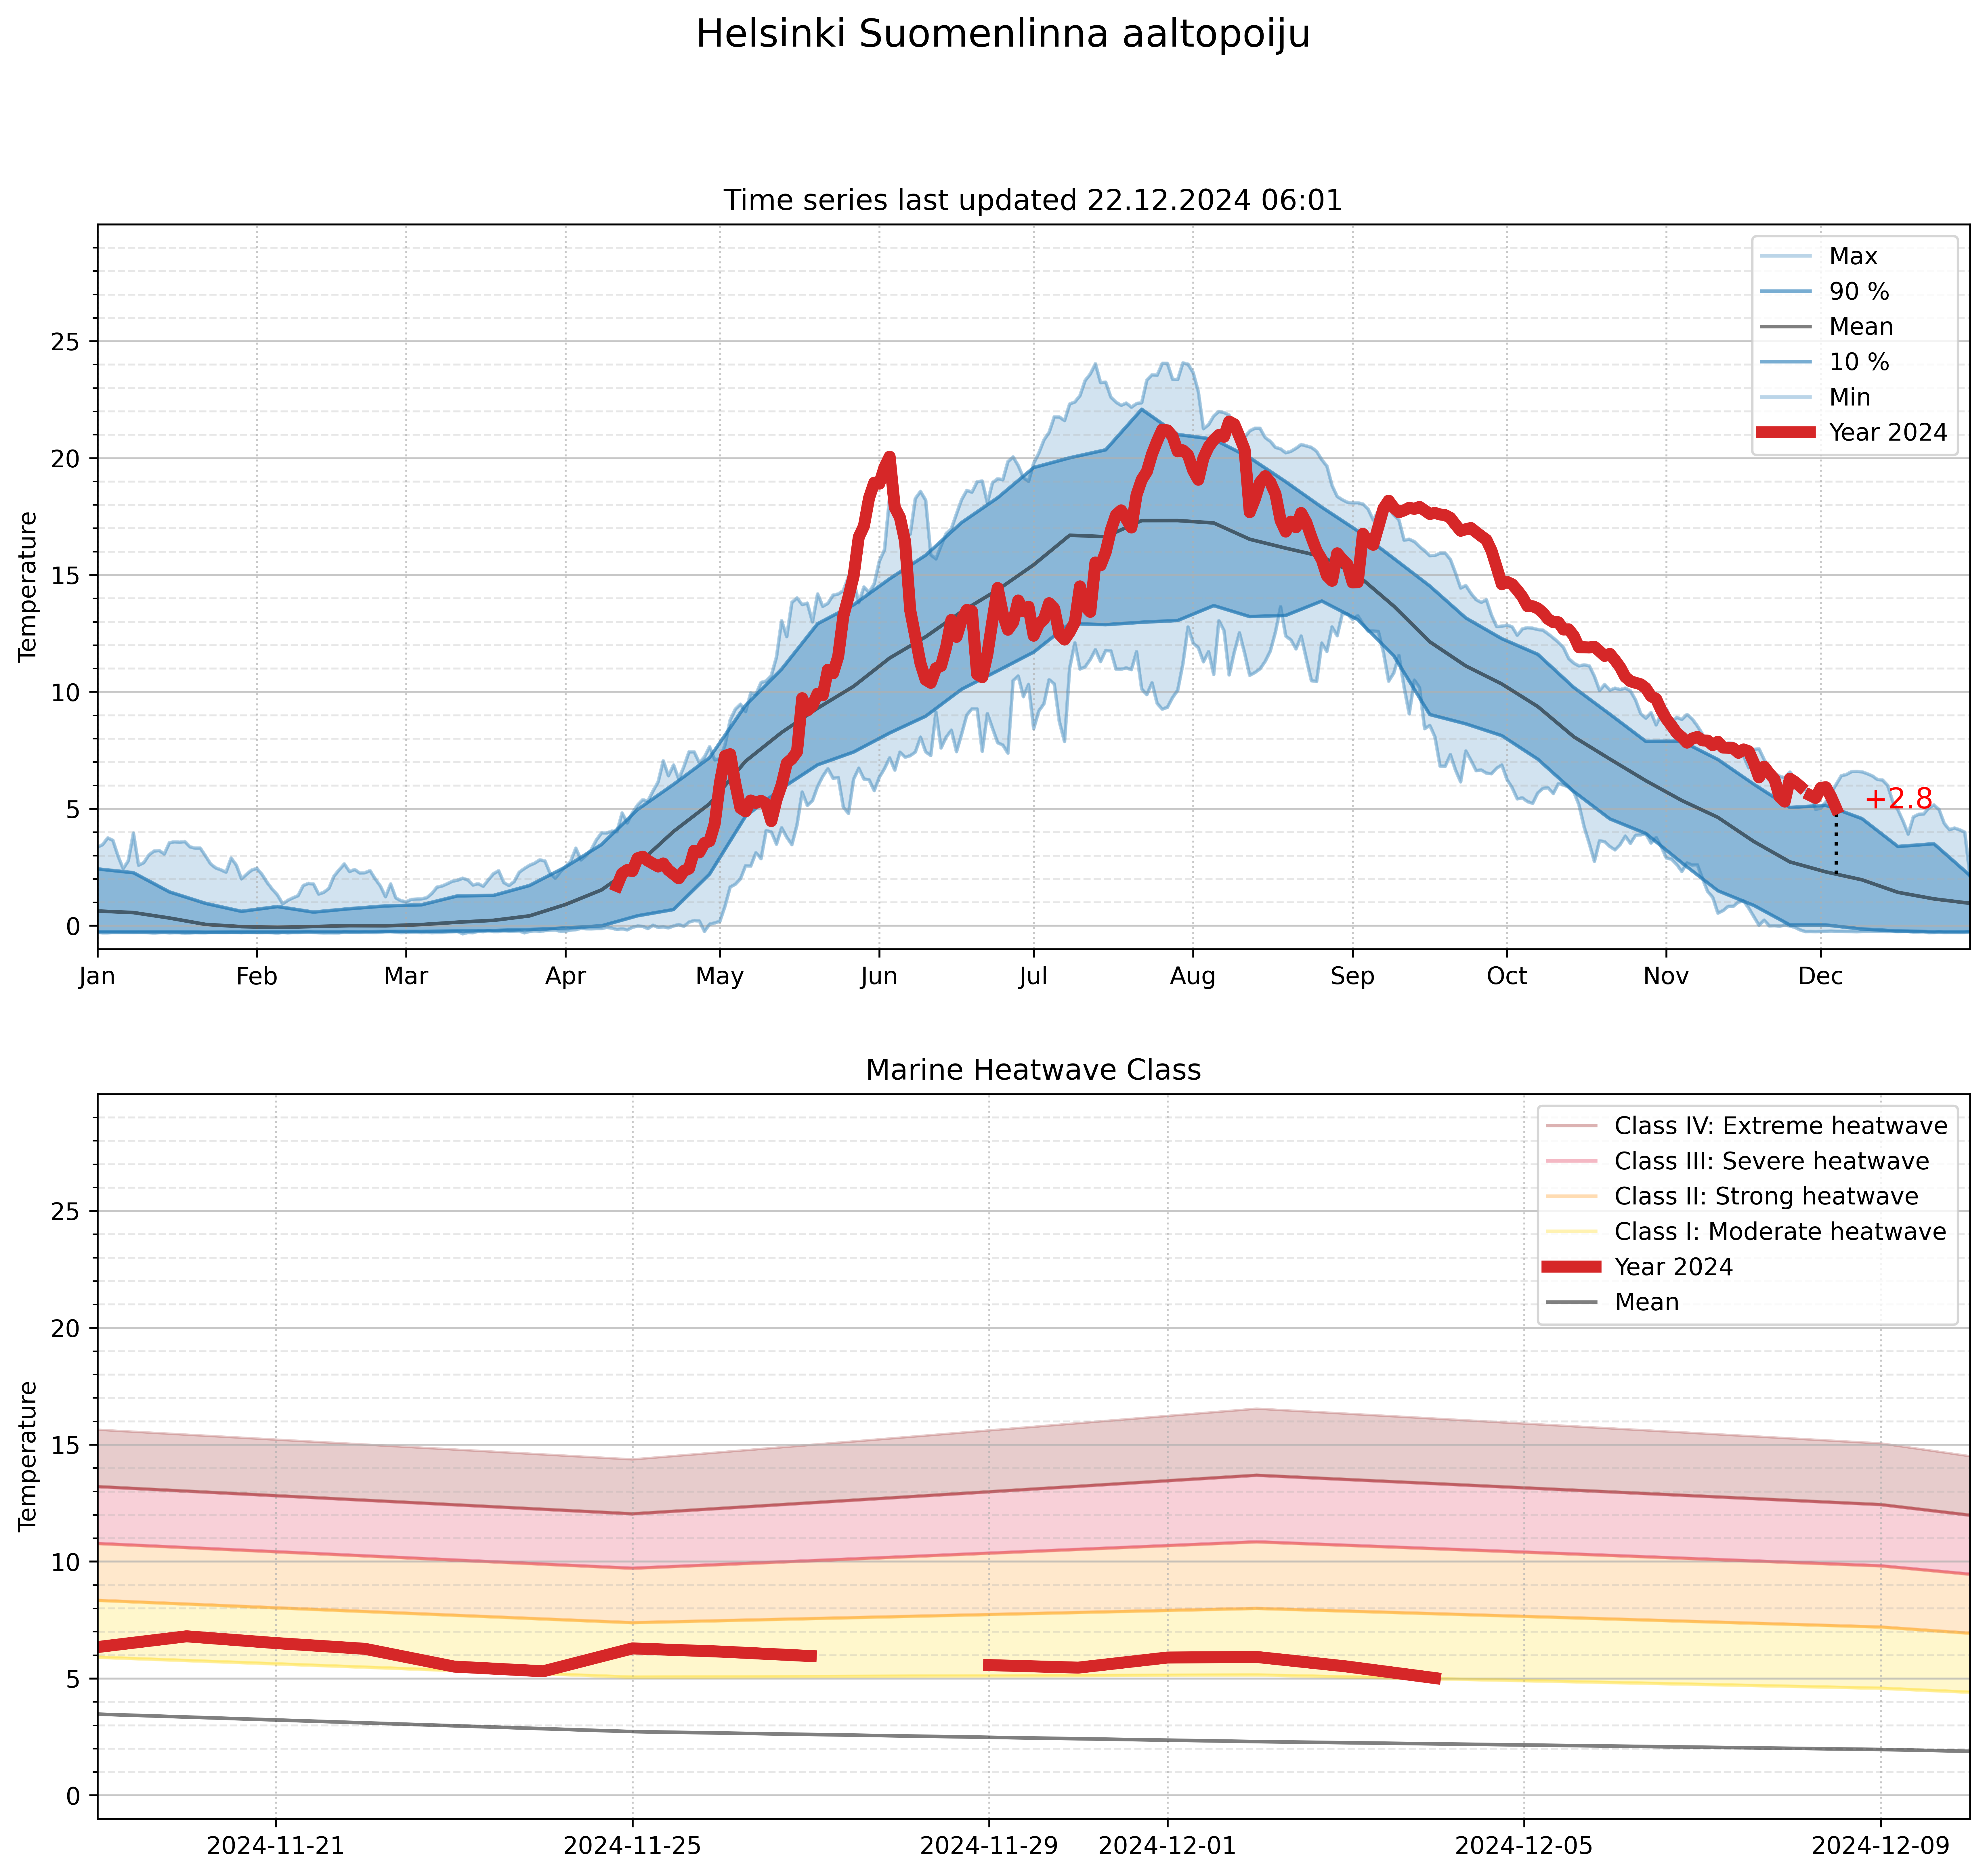
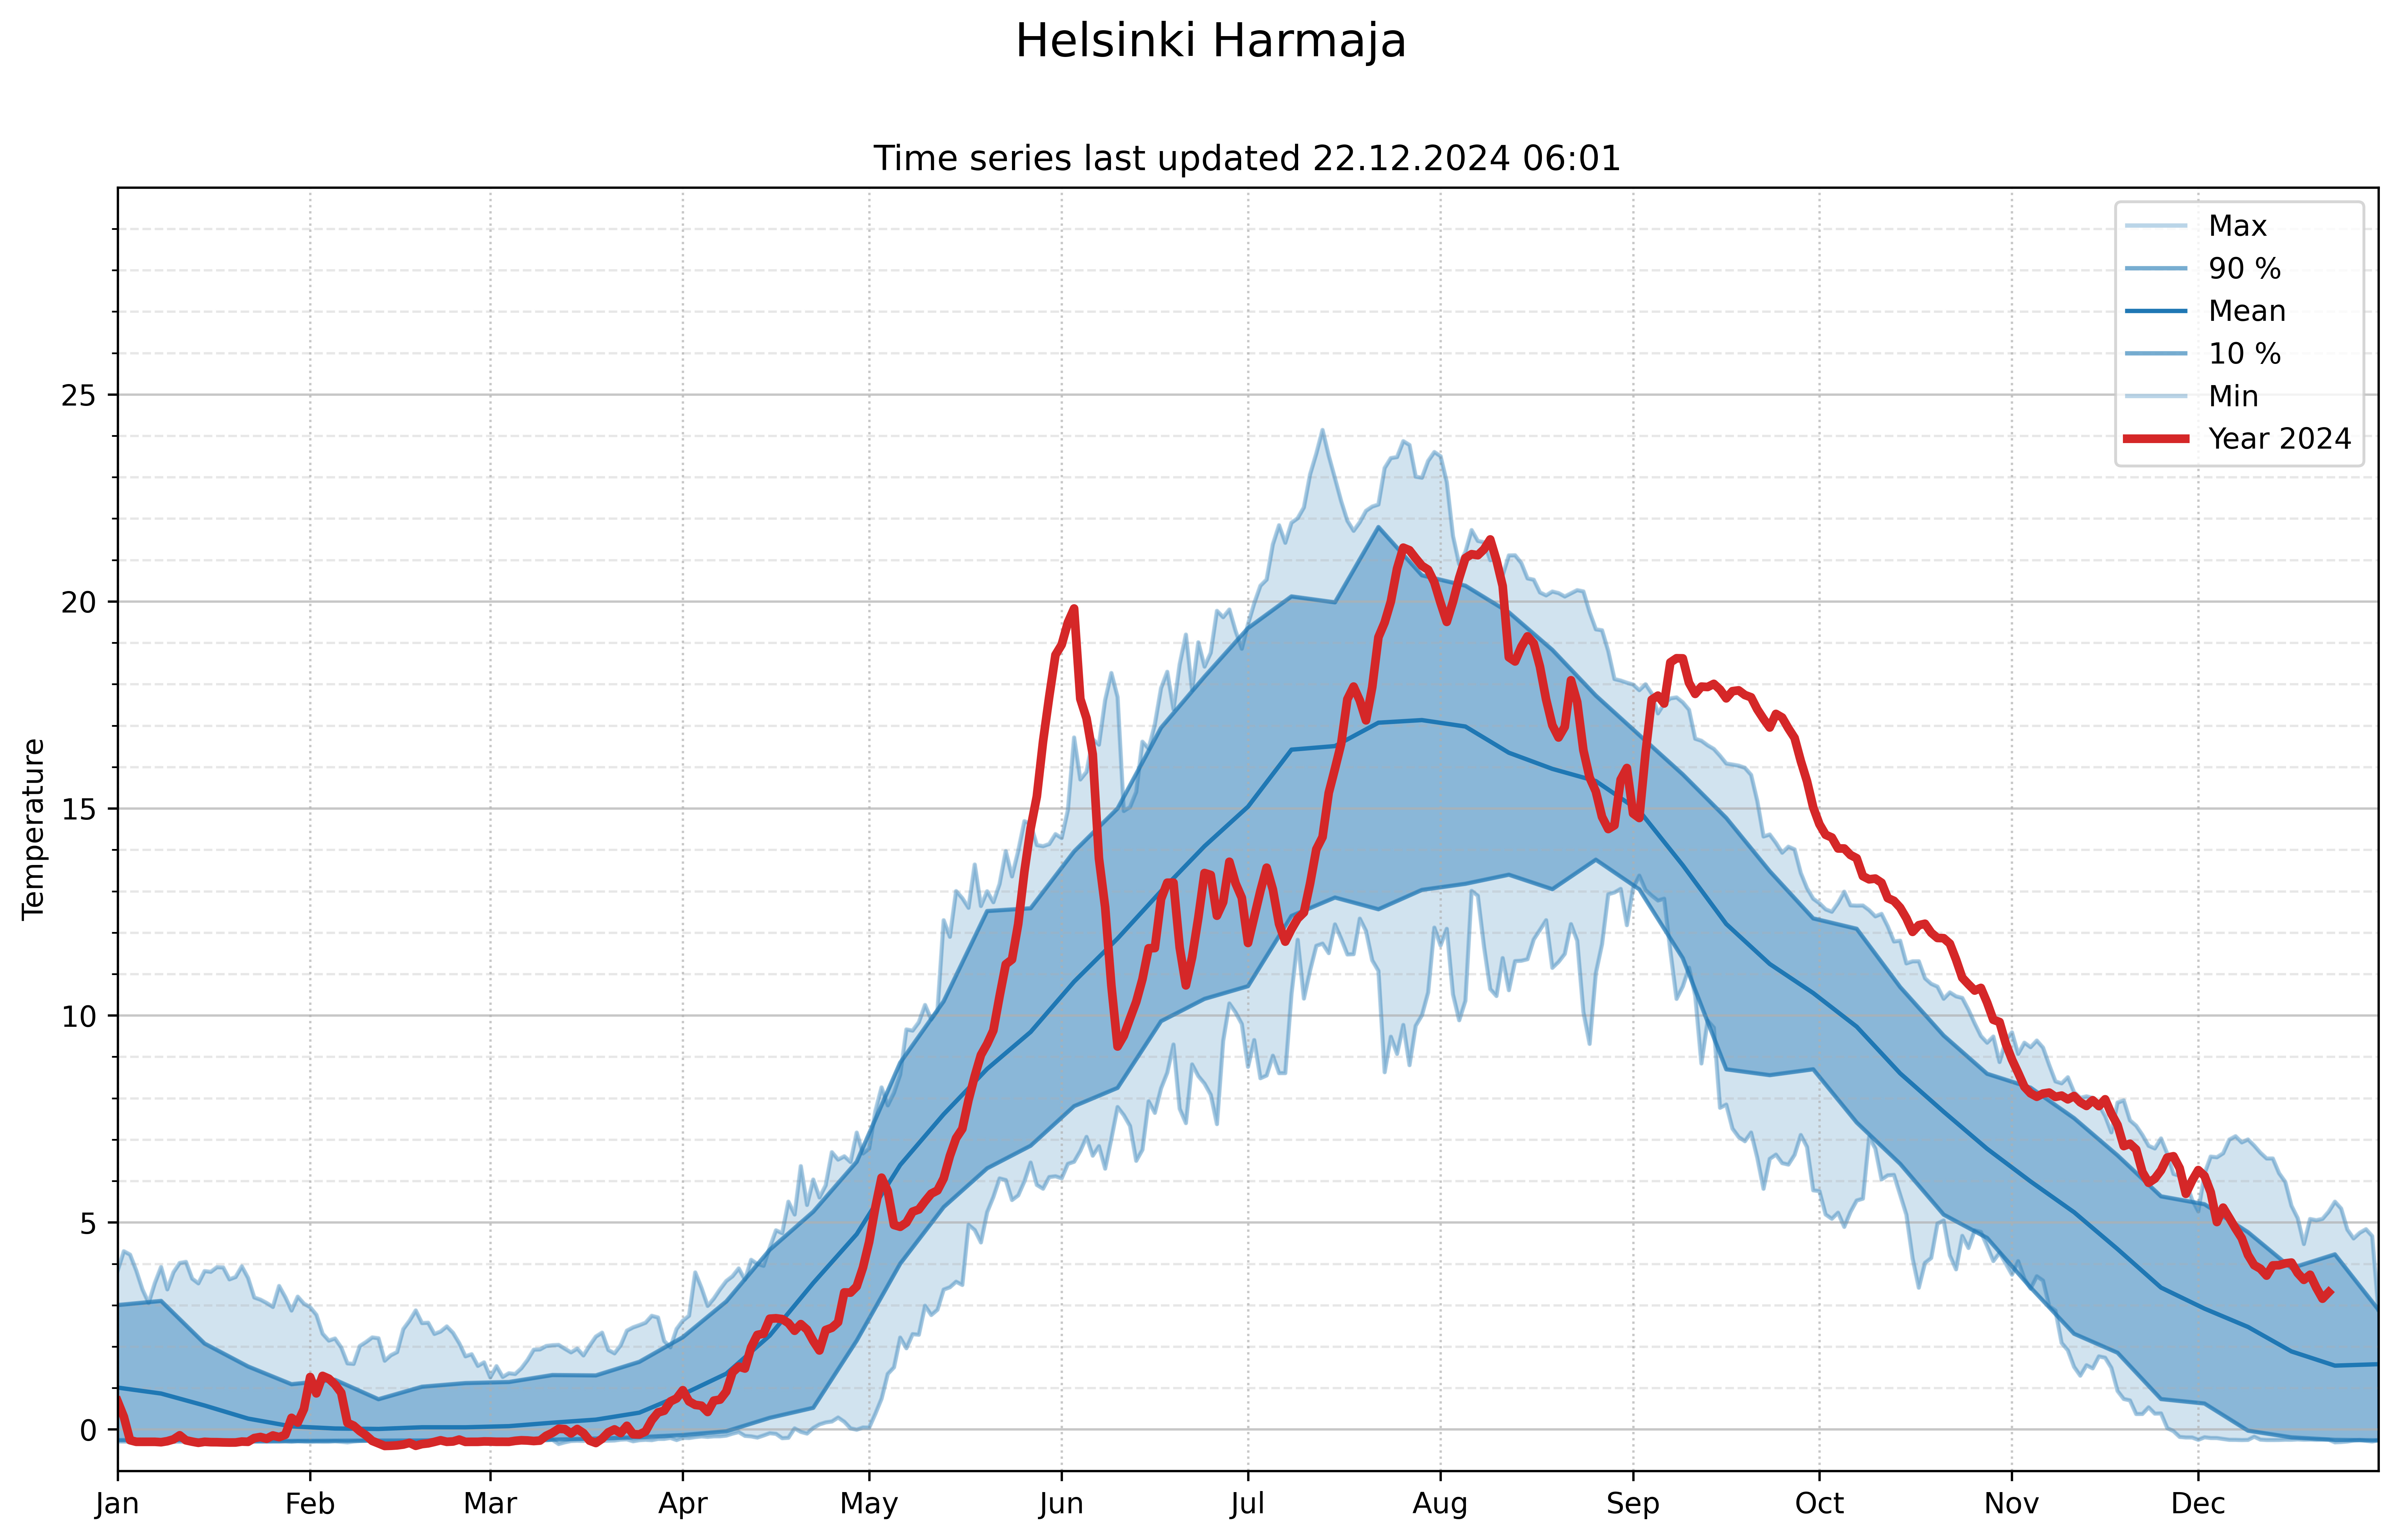
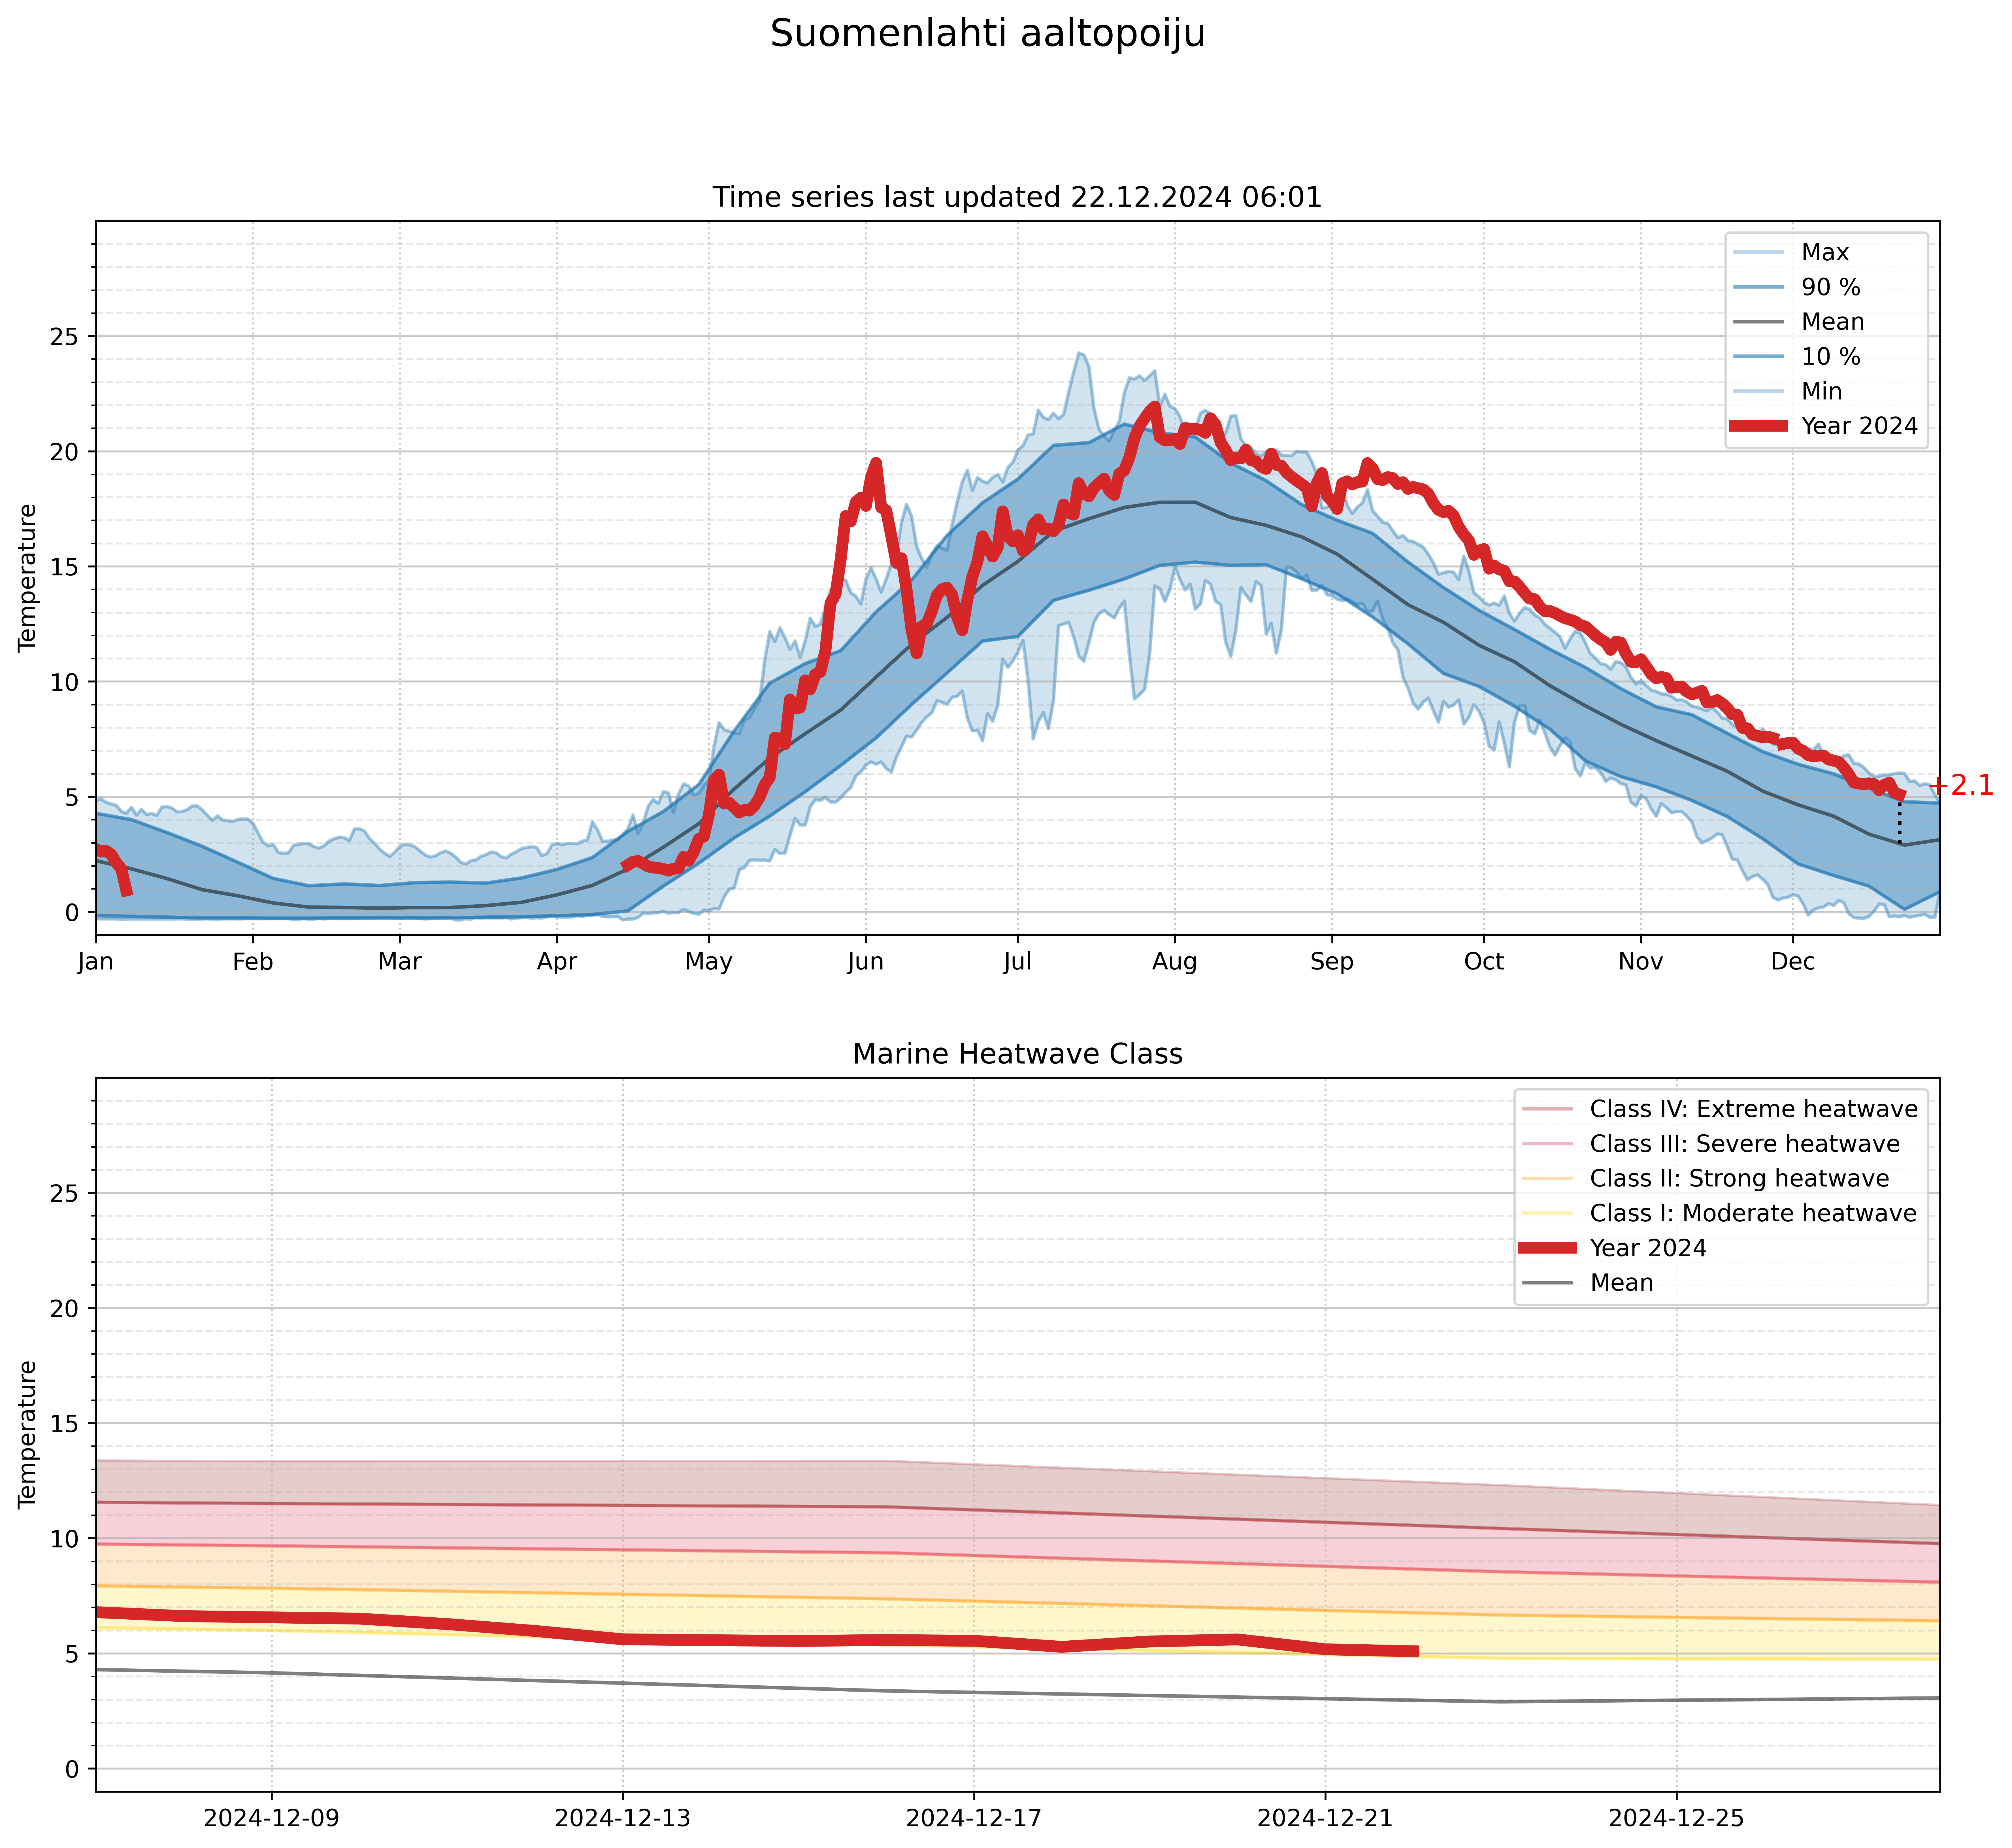
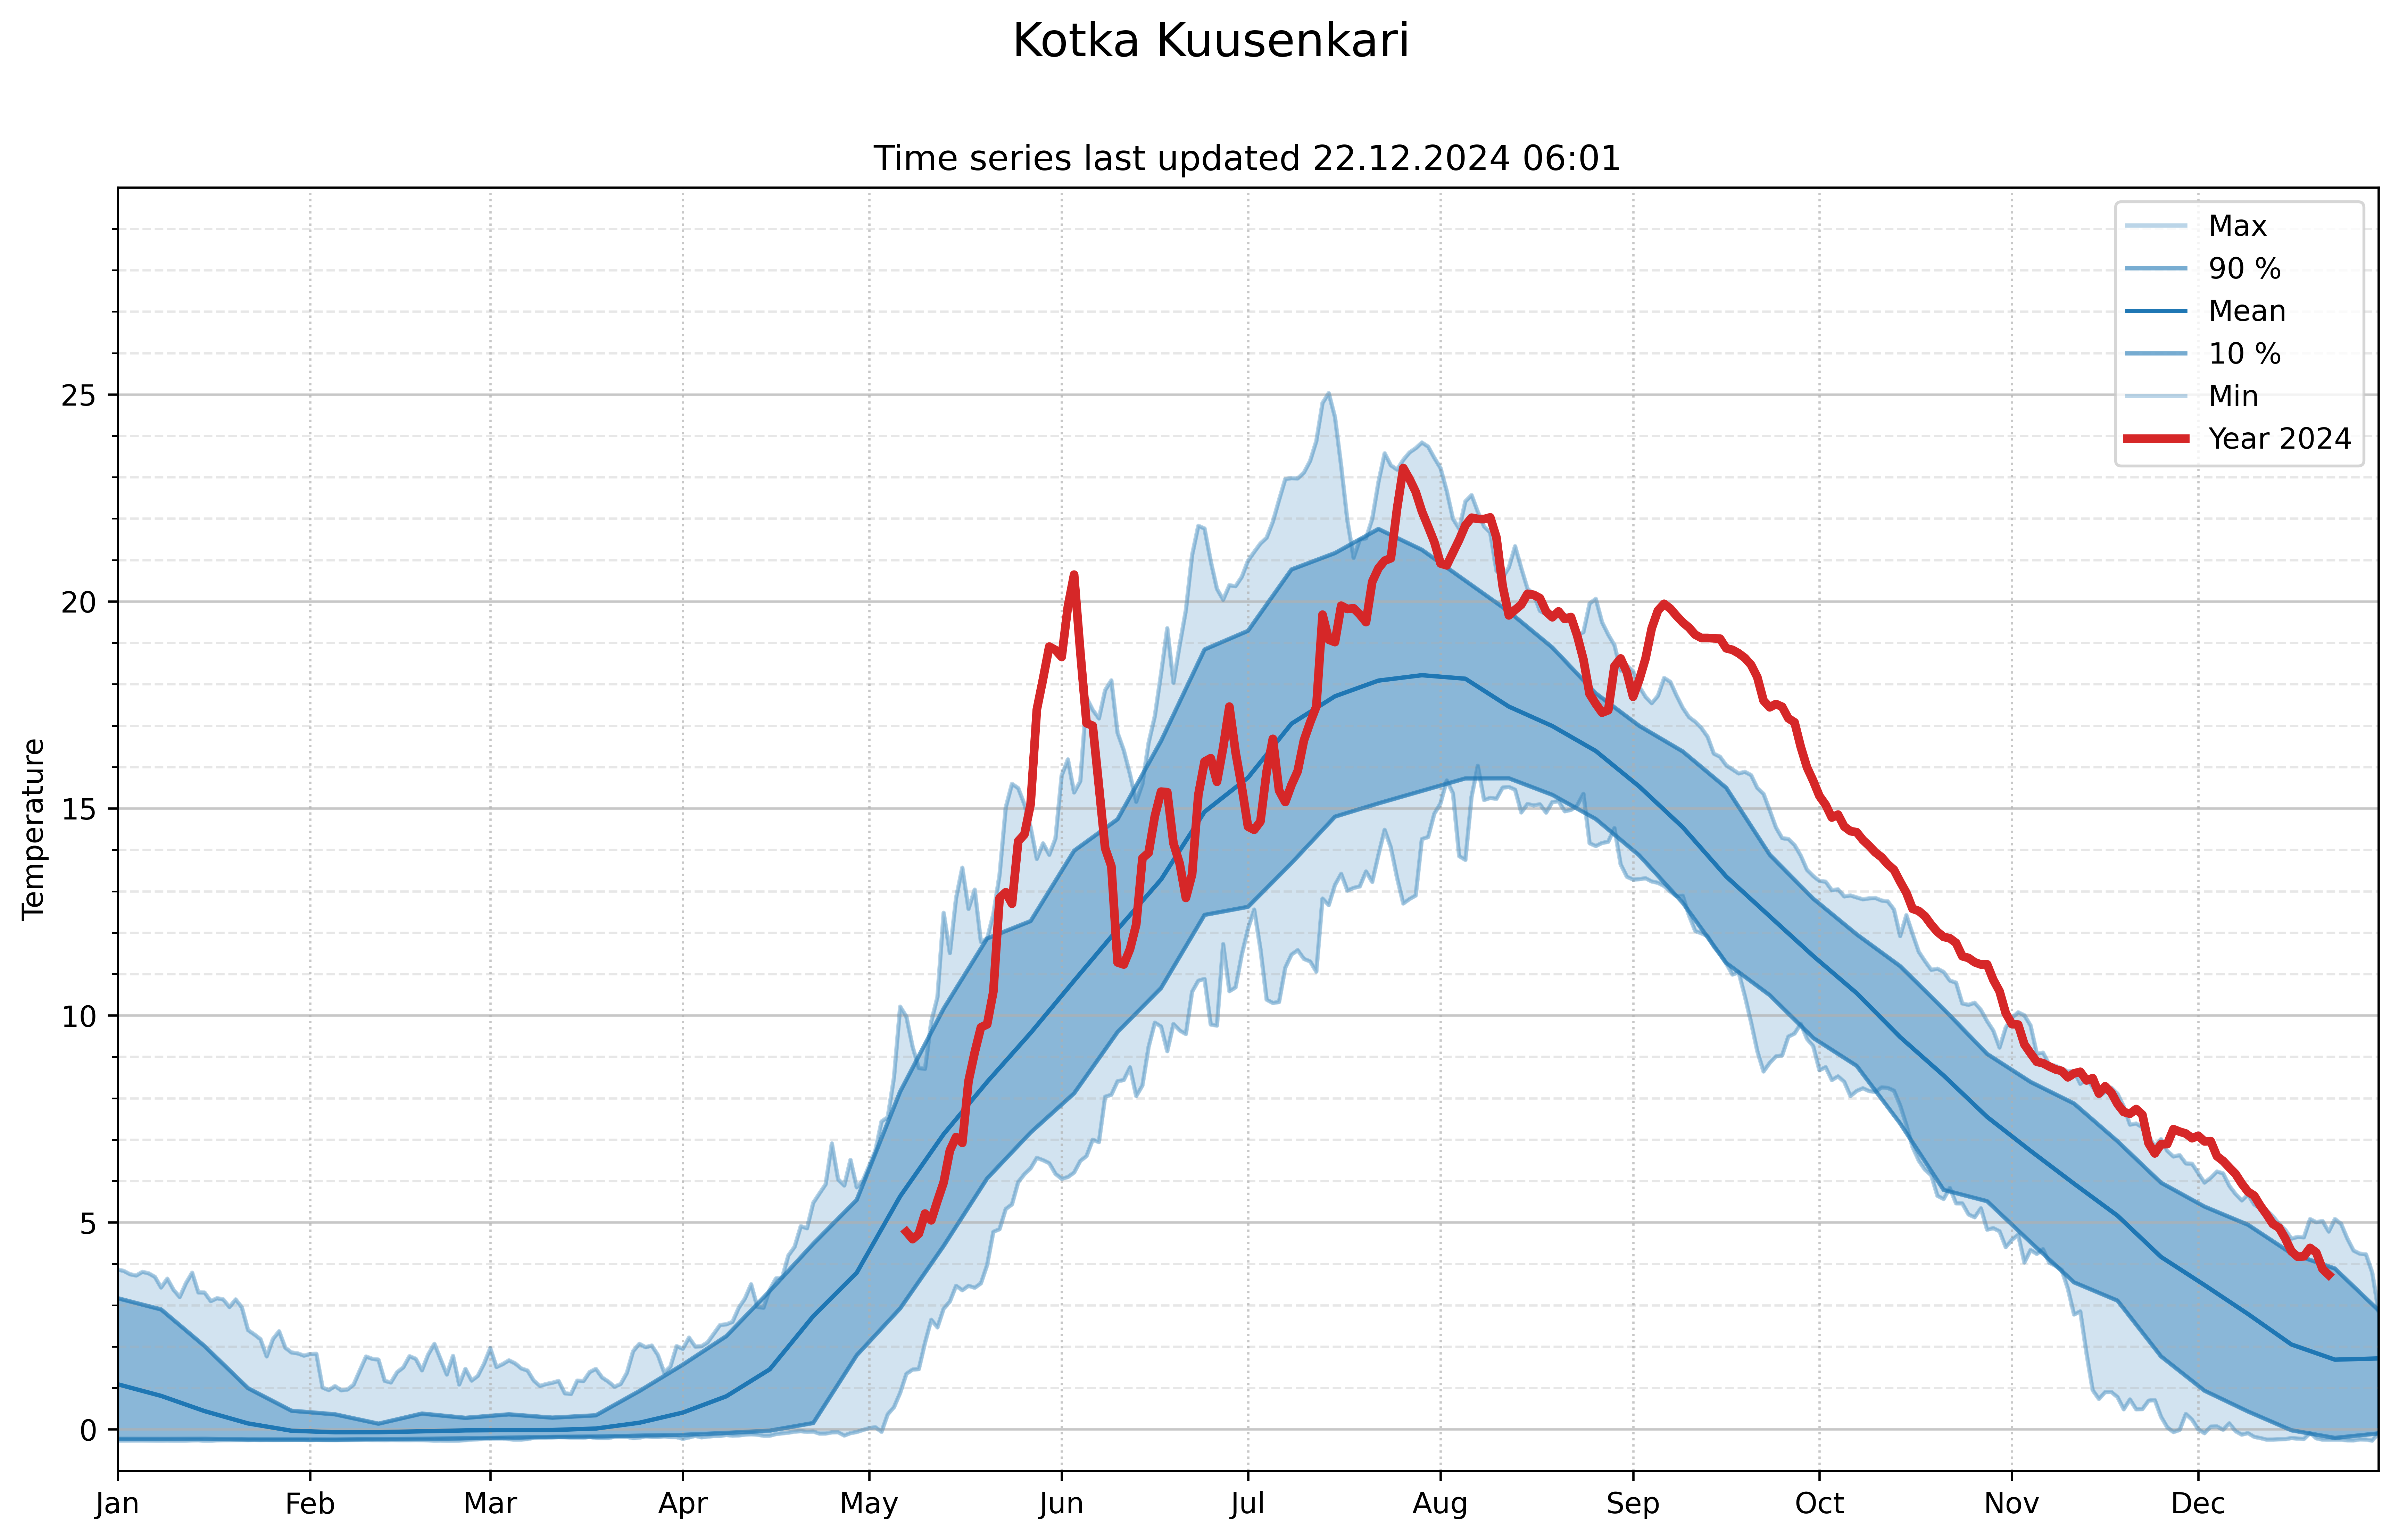
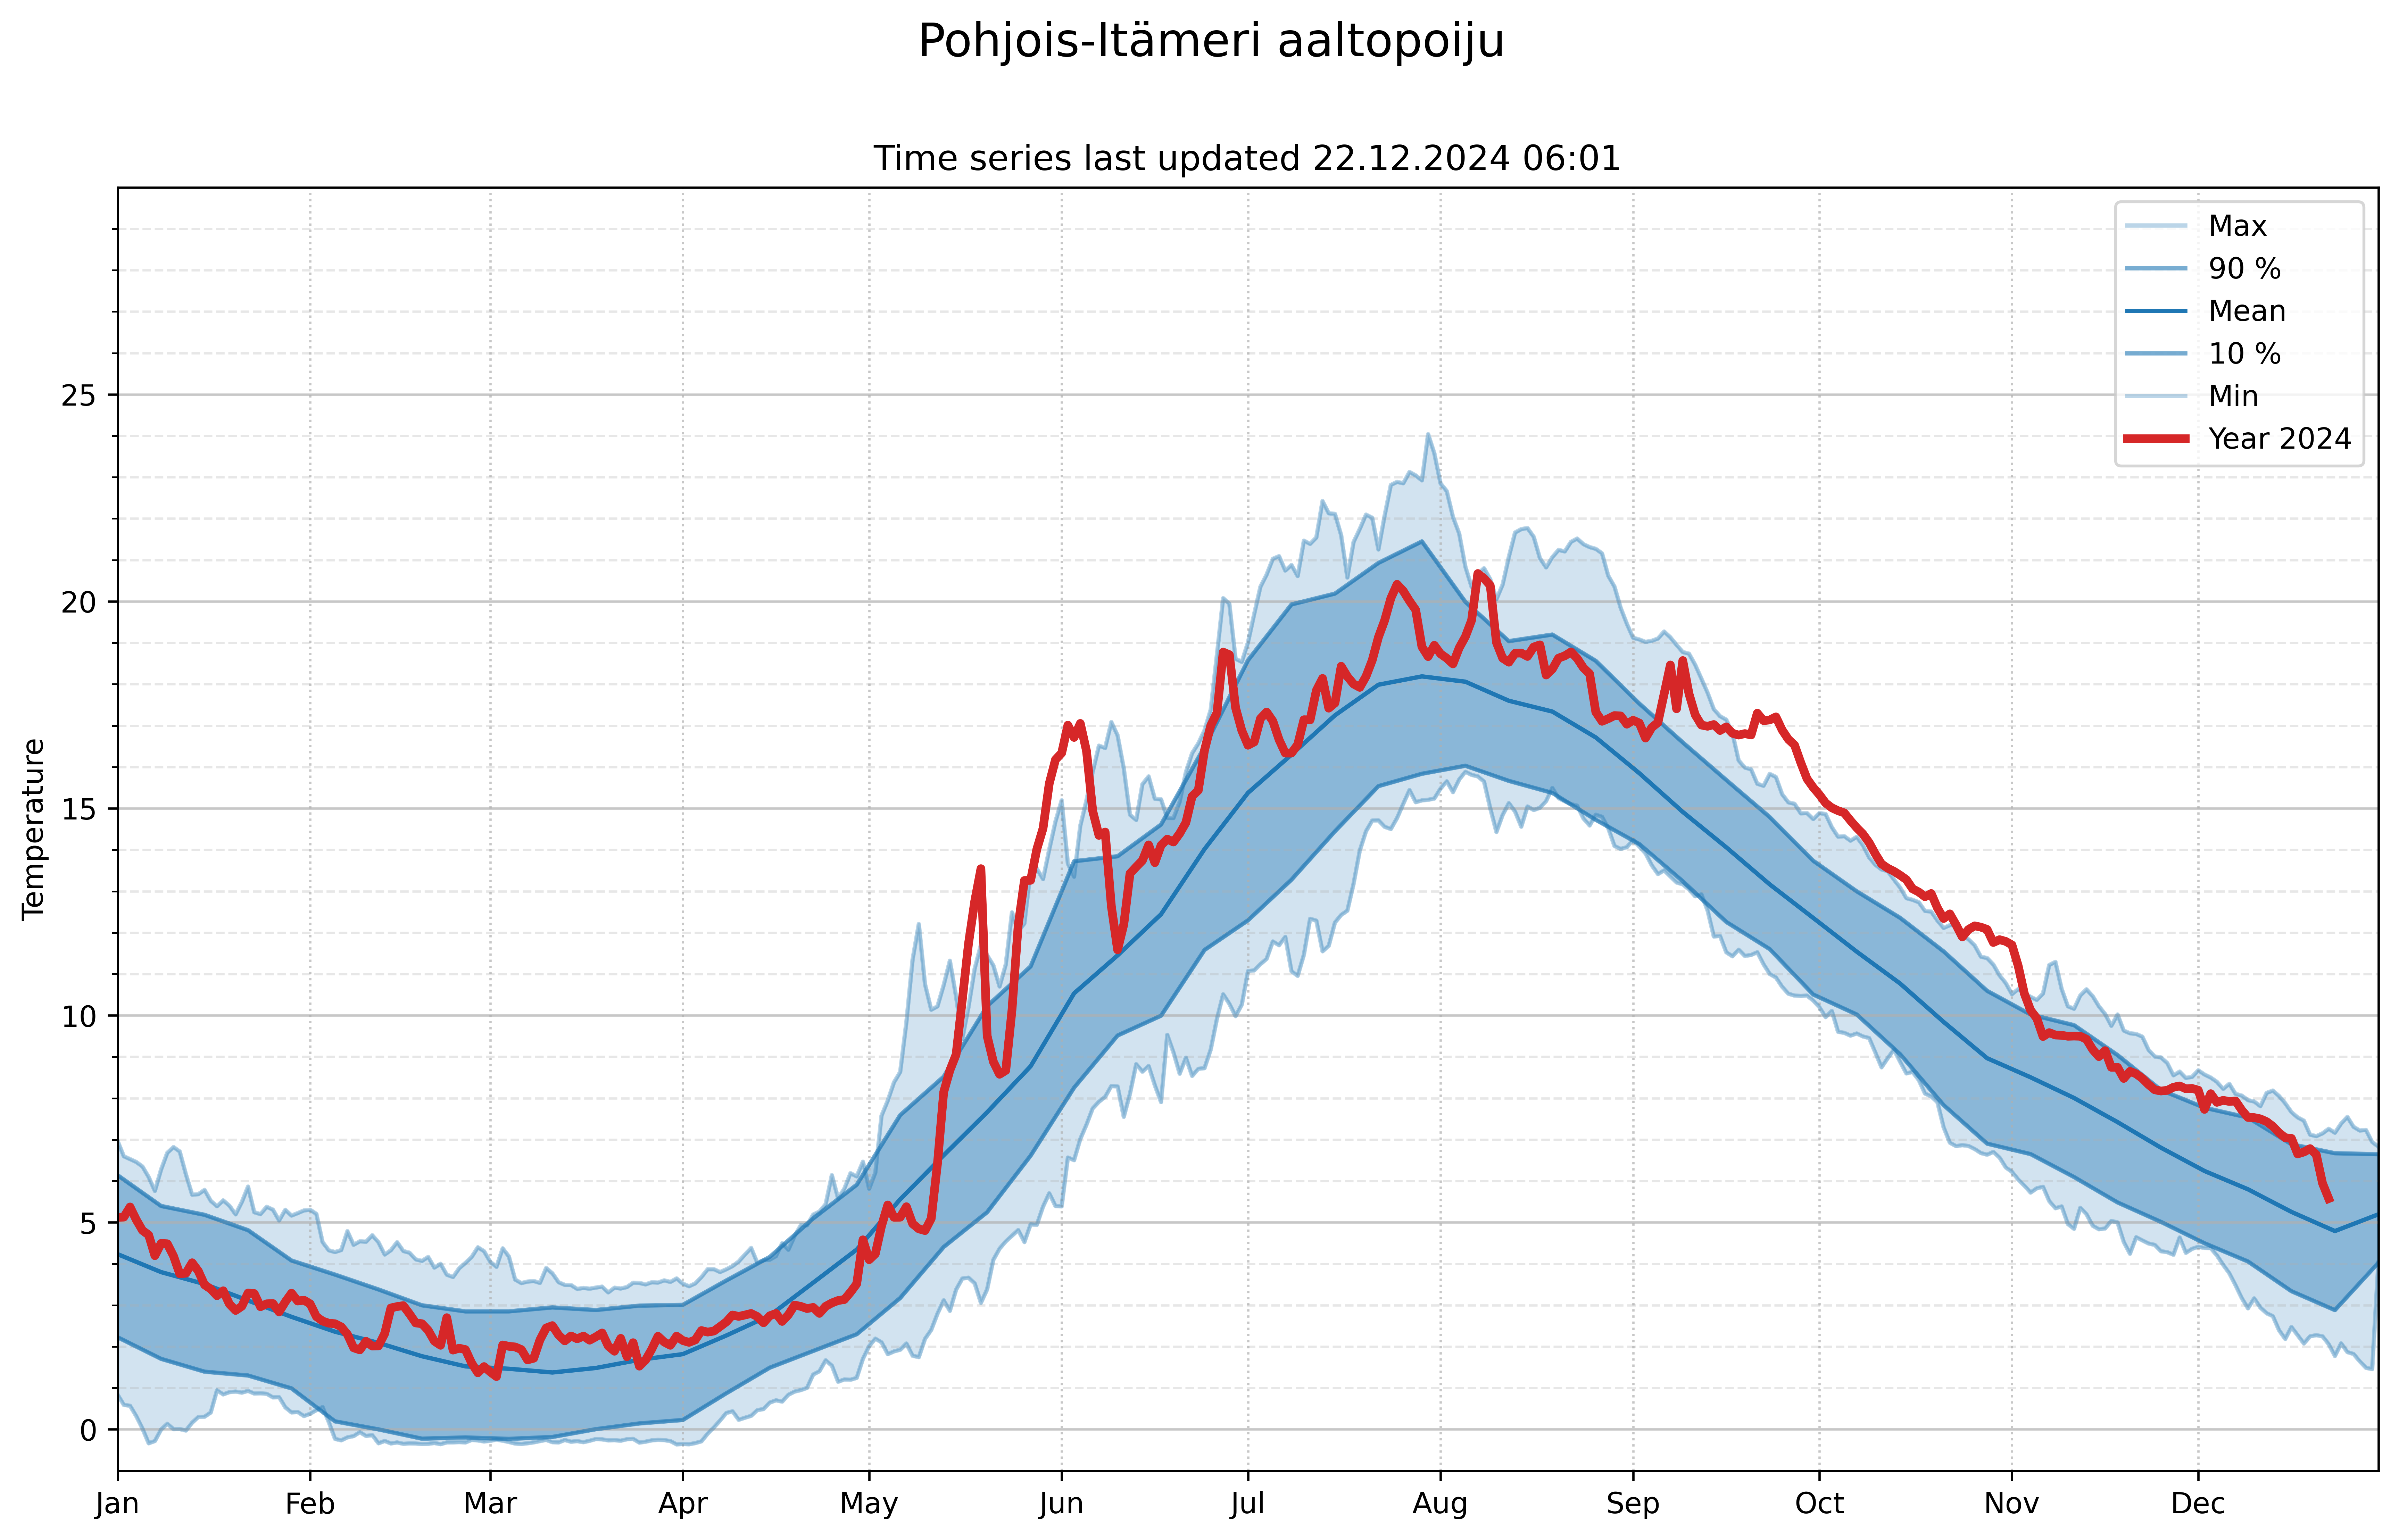
These pages contain marine heatwave classes and temperature timeseries for the Baltic Sea. The heatwave events have been classified following Hobday et al. (2018). The considered temperatures have been measured by wave and temperature buoys. The current year has been compared with reanalysis and measurements. These have been presented in respective subpages. The temperature measurements used for the analysis are freely available via the FMI open data interface (https://en.ilmatieteenlaitos.fi/open-data). The Baltic Sea Physics Reanalysis produced by Copernicus Monitoring Environment Marine Service (CMEMS) is also freely available at https://doi.org/10.48670/moi-00013.
The figures include maximum, minimum, mean, 90th percentile, and 10th percentile values computed from the climatology. The time series is presented from the beginning of January until the end of December. In case of a heatwave, an additional figure is created to visualize the change in heatwave class within the current heatwave event.
Hobday, A.J., E.C.J. Oliver, A. Sen Gupta, J.A. Benthuysen, M.T. Burrows, M.G. Donat, N.J. Holbrook, P.J. Moore, M.S. Thomsen, T. Wernberg, and D.A. Smale. 2018. Categorizing and naming marine heatwaves. Oceanography 31(2):162–173, https://doi.org/10.5670/oceanog.2018.205.
ObsSea4Clim is funded by the European Union. Views and opinions expressed are however those of the author(s) only and do not necessarily reflect those of the European Union or the European Research Executive Agency (REA). Neither the European Union nor the granting authority can be held responsible for them.
